
Warehouse capacity planning matches your usable storage and operational throughput to forecasted demand. Start today by measuring usable cubic capacity and calculating your current utilization percentage. If that number sits between 80% and 85%, you’re in the operational sweet spot. Above 90%, treat it as an alarm, not a milestone.
TL;DR:
- Maintaining utilization between 80% and 85% optimizes warehouse efficiency without risking overload during volume spikes.
- Vertical expansion and slotting adjustments offer the highest return on capacity improvements before considering costly automation or new leases.
- Regular quarterly and annual reviews, plus immediate reassessment after demand shifts, keep capacity planning accurate amid changing SKUs and volume patterns.
- Tracking key KPIs such as zone occupancy, picks per hour, and dock-to-stock time ensures capacity plan health and highlights bottlenecks early.
- Addressing inventory count accuracy and optimizing existing space often yields more capacity than costly racking or technology investments.
Table of Contents
- What Warehouse Capacity Planning Actually Covers
- How Do You Calculate Warehouse Capacity and Utilization?
- What Factors Should You Include In Your Capacity Model?
- How Often Should You Review Warehouse Capacity?
- Which In-Place Capacity Levers Work Best?
- What Should Be On Your Peak-Season Capacity Checklist?
- Which KPIs Show Whether Your Capacity Plan Is Working?
- What Operator-Led Capacity Fixes Actually Look Like
- The Two Mistakes That Sink Most Capacity Plans
- How 3plcowboy Helps You Act On These Numbers
- Sources
- FAQ
What Warehouse Capacity Planning Actually Covers
Capacity planning warehouse teams run into trouble when they treat storage and throughput as the same problem. They aren’t. Usable storage cubic feet tells you how much product you can hold. Throughput capacity tells you how much product you can move through receiving, putaway, picking, and shipping in a given hour or shift. A facility can have plenty of open pallet positions and still fail its customers because the dock can’t process inbound trailers fast enough, or because pickers can’t clear orders before the truck leaves.
Storage capacity constraints matter most when a facility is genuinely full. Throughput constraints matter most during volume spikes, when the bottleneck is people and process speed, not empty square footage. Effective warehouse logistics require modeling both, because a slotting fix that solves storage utilization can quietly create a picking bottleneck if you don’t check the labor math alongside it.
A warehouse management system (WMS) tied to accurate, real-time inventory data is what makes either calculation trustworthy; learn more about how to track inventory across fulfillment centers for better capacity management. Without it, you’re planning against numbers that are already stale by the time you act, and WMS visibility supports dynamic slotting decisions that static spreadsheets simply can’t keep up with.
- Storage capacity: how much cubic volume your racking, floor, and reserve locations can hold
- Throughput capacity: how many units, orders, or pallets you can process per hour or shift
- Data quality: the WMS and forecast accuracy that make both numbers usable for decisions
How Do You Calculate Warehouse Capacity and Utilization?
The math is simpler than most managers expect, but it only works if you measure the right inputs first.
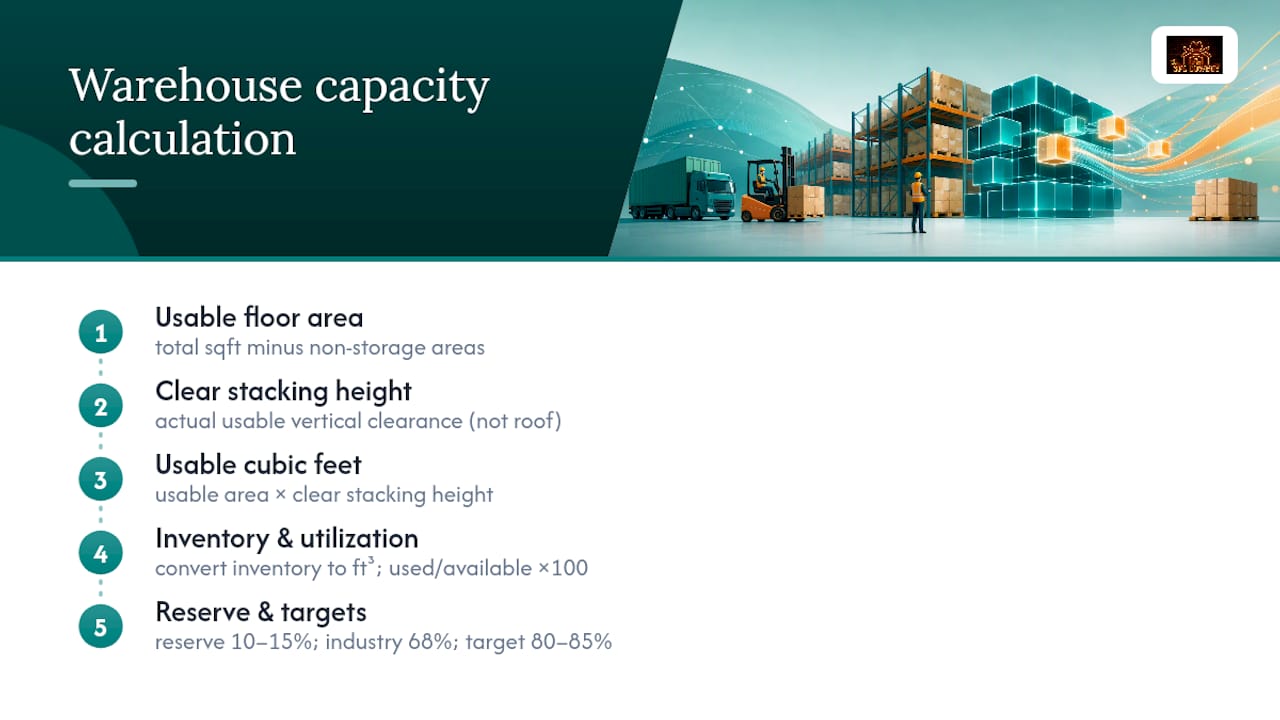
Step 1: Find usable floor area. Take total square footage and subtract offices, dock staging, battery charging stations, and any permanently blocked columns or fire lanes. What’s left is your usable storage footprint.
Step 2: Apply clear stacking height. Multiply usable floor area by clear stacking height, which is the actual vertical space you can use before hitting sprinkler clearance, HVAC ductwork, or structural obstructions, not the building’s roof height. This gives you usable cubic feet, and getting this step wrong is the single most common error in capacity math, since usable capacity depends on clear stacking height minus safety clearances, not raw ceiling height.
Step 3: Convert inventory to cubic feet and calculate utilization. Convert your current pallet and carton volumes into cubic feet, then divide used cubic feet by available cubic feet and multiply by 100.
Pro Tip: Reserve 10 to 15% of usable capacity for volatility before you call a facility “full.” A warehouse running at 100% on paper has zero room for a receiving surge, a slow-moving return, or a forecast miss.
Average warehouse utilization across the industry centers around 68%, which means most facilities are running well below efficient capacity, not over it. The operational target most experienced operators hold to is 80% to 85%, high enough to justify the lease cost, low enough to absorb a peak without renting emergency overflow space at premium rates.
What Factors Should You Include In Your Capacity Model?
A capacity number built on floor space alone will mislead you every time. Six variables belong in any serious model, and skipping even one tends to be where the plan falls apart three months later.
- Demand volatility and seasonality: a facility sized for average daily volume will choke during a promotional spike or holiday ramp.
- SKU dimensional profiles: odd-shaped or oversized items eat cube faster than unit counts suggest, and storage media (pallet rack, shelving, flow rack) has to match the mix.
- Layout constraints: columns, dock doors, and aisle widths dictate how much of your “square footage” is actually usable versus structural dead space.
- Clear height and MHE reach: sprinkler lines and rack-to-ceiling clearance cap your vertical storage, and your forklifts or reach trucks have to physically reach whatever height you’re counting.
- Labor mix and scheduling: cross-trained staff who can flex between receiving and picking absorb throughput spikes that a rigid schedule can’t.
- System and data limitations: a WMS running on outdated location data will report capacity that doesn’t match the floor.
Rising e-commerce volume amplifies nearly all of these at once. Global retail e-commerce sales have continued climbing, and that growth doesn’t arrive evenly. It shows up in sharper peaks, which is exactly why volatility has to be modeled explicitly rather than averaged away.
How Often Should You Review Warehouse Capacity?
Capacity planning isn’t a once-a-year exercise you file away after budgeting season. It’s a cadence with clear owners and clear triggers for when to break from the schedule.
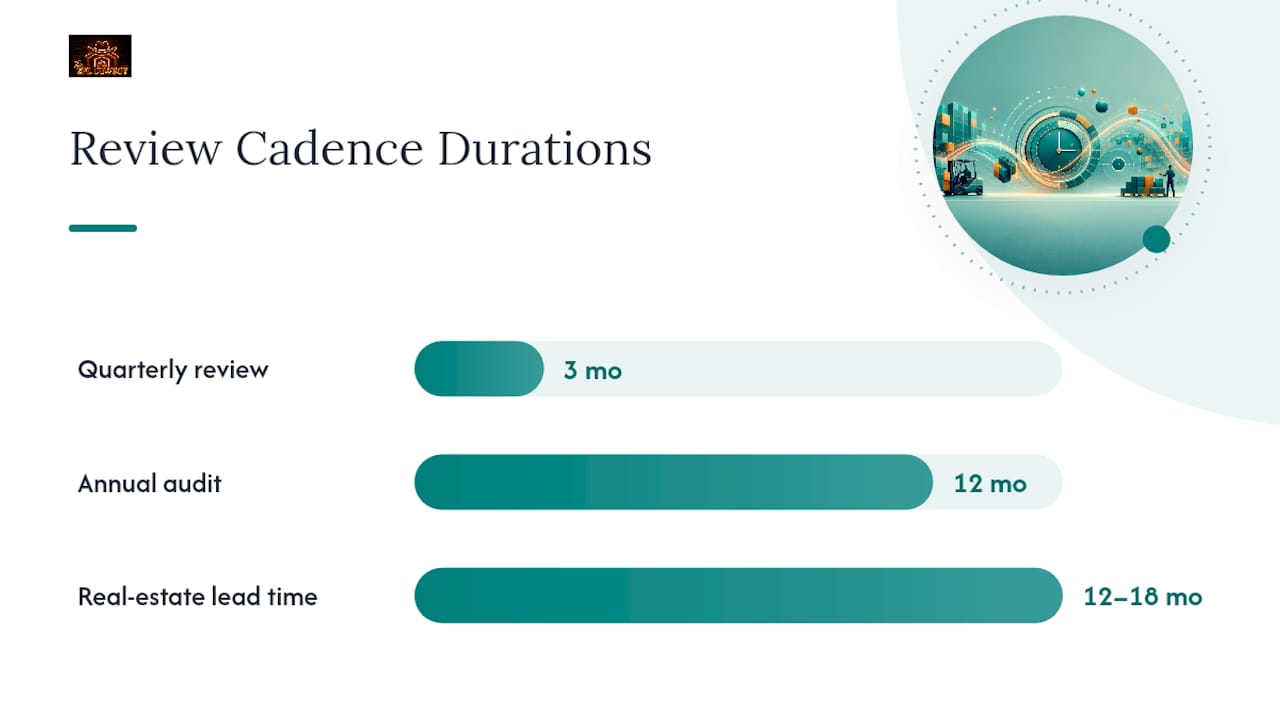
- Run a quarterly capacity review. Pull peak on-hand units by SKU, daily receipts and picks, current slotting maps, equipment inventory, and labor rosters. This is the baseline data every scenario depends on.
- Run a full annual audit. Walk the floor, remeasure clear height against current rack configurations, and validate that your WMS location data matches physical reality.
- Reassess immediately outside the schedule when SKU mix shifts materially or you land a major new customer. Waiting for the next quarterly cycle after a demand shock is how facilities get blindsided.
- Build three scenarios, not one. A baseline forecast, an aggressive growth case, and a conservative downside case, each translated into projected utilization percentage.
- Calculate your runway. Take current utilization, your growth trajectory, and your reserve buffer to estimate months until you outgrow the facility.
Industrial real estate deals, from broker outreach to lease execution, routinely take 12 to 18 months, and waiting until you’re already cramped puts you negotiating from a position of urgency instead of leverage.*
Set decision triggers ahead of time: a utilization threshold that flags review, a lease term that’s approaching renewal, and a market tightness signal (rising asking rates in your target submarket) that tells you whether to renew, expand, or relocate.
Which In-Place Capacity Levers Work Best?
Before signing a new lease, most facilities have unused capacity hiding in plain sight. Four levers typically get evaluated in this order, from cheapest to most capital-intensive.
- Vertical expansion. Adding high-bay racking or a mezzanine is usually the highest-ROI move available, since insiders treat vertical space as the primary capacity buffer before ever considering horizontal expansion. The catch: going higher than your current forklifts can reach means a forklift or reach-truck upgrade, plus a fresh look at fire-suppression compliance.
- Slotting and pick-face changes. Moving high-velocity SKUs closer to shipping and consolidating slow movers into reserve locations recovers both storage cube and picking speed without touching a wall. Slotting-driven pick-path work has cut walking distance by 20% to 46% in facilities that treated it as a standalone project rather than an afterthought.
- Aisle narrowing. Switching to narrow-aisle or very-narrow-aisle configurations reclaims storage positions, but it requires specialized turret trucks or wire-guided equipment, which is a real capital and training commitment.
- Targeted automation. AS/RS and goods-to-person systems deliver the strongest returns in facilities with dense SKU counts and steady, high-volume flow. For mid-sized operations, slotting and packaging fixes often beat automation on speed to ROI, since automation paybacks tend to stretch out over years, not quarters.
Pro Tip: Run the slotting fix before the automation study. It’s cheaper, faster, and it often changes the automation business case entirely once the flow is cleaned up.
What Should Be On Your Peak-Season Capacity Checklist?
Seasonal surges expose capacity gaps that quarterly reviews miss, because peak-day demand can run several multiples above your average. A reusable checklist beats rebuilding the plan from scratch every year.
- Project peak on-hand units by storage type. Break this down by pallet, case, and each location, not a single blended number.
- Map daily task volumes against labor capacity. Receiving, putaway, picking, and shipping each have their own throughput ceiling, and they rarely hit peak stress at the same time.
- Identify zone pinch points before they happen. Walk the floor and flag which zones historically choke first, whether that’s a single dock door or an undersized staging lane.
- List temporary protection measures. Forward pick locations, overflow staging in underused aisles, and surge shift schedules all buy capacity without a lease.
- Set KPI triggers that force a decision. Define the exact utilization or dock-to-stock number that tells you to activate the next tactic on the list.
That five-point structure mirrors what seasonal peak planning guides recommend testing before every ramp: peak on-hand, task volumes, pinch points, protection measures, and triggers, checked in that order every single cycle. Flow constraints tend to bite before storage constraints do, so test throughput first even though storage feels like the more obvious question.
When in-house tactics run out of runway, using overflow capacity from third-party logistics providers can be a cost-effective alternative to paying overtime and temp-labor premiums through an entire peak season. Compare the fully loaded cost of both before the surge hits, not during it, and lean on peak and overflow capacity planning as a standing option rather than a last-minute scramble.
Which KPIs Show Whether Your Capacity Plan Is Working?
A capacity plan without dashboard-level KPIs is a guess dressed up as a strategy. Six metrics deserve a permanent spot on the operations dashboard, reviewed weekly at minimum and daily during peak.
- Occupancy by zone (%): utilization broken out by zone, not just facility-wide, since one full zone can mask three empty ones.
- Picks per hour: the core throughput metric that flags labor or process bottlenecks before they cascade.
- Replenishment response time: how fast forward-pick locations get refilled once they run low.
- Dock-to-stock time: how long inbound freight sits before it’s put away and sellable.
- Putaway aging: inventory sitting in receiving longer than it should, a leading indicator of a bottleneck upstream.
- Inventory accuracy (cycle-count rate): because a capacity plan built on inaccurate location data will always be wrong, no matter how good the formula is.
Tie the thresholds to the same benchmarks used earlier: 80% to 85% utilization as the operational target, with anything above 90% triggering an immediate escalation to the operations manager, not a note for next quarter’s review.
What Operator-Led Capacity Fixes Actually Look Like
Michael Nooner built 3plcowboy on more than 17 years of hands-on operating leadership, running fulfillment and inventory functions across major retail and logistics operations before founding the advisory. That background shapes the playbook here: fix the process before you touch the capital budget.
One recurring pattern across those engagements: cycle-count accuracy problems and capacity problems are often the same disease wearing different symptoms. Inventory operations that clean up count accuracy tend to uncover real, usable capacity they didn’t know they had, because inflated or mislocated inventory records were masking open positions. A pallet-program redesign follows the same logic. Standardizing pallet configurations frequently frees more cube than any racking purchase, and it costs a fraction as much. WMS rollouts across multi-site networks teach a blunter lesson: the technology only works if the underlying process and slotting logic are sound first.
An operator-led advisory prioritizes these pragmatic, low-capital fixes over vendor pitches that lead straight to automation, because the fastest capacity gains usually come from cleaning up what you already have.
The Two Mistakes That Sink Most Capacity Plans
The biggest mistake I see: teams measure floor area and stop, ignoring vertical cube that’s sitting empty above every rack row. Fastest fixes: reslot your top SKUs this week, stand up temporary forward-pick locations, and run short daily audits until the numbers stabilize.
— Michael
How 3plcowboy Helps You Act On These Numbers
3plcowboy is the alternative to guessing your way through a capacity crunch or taking whatever a 3PL sales rep pitches you on a discovery call. If your utilization math says you’re outgrowing your facility, or you’re weighing whether to expand in place versus outsource overflow, that’s a decision worth underwriting properly instead of deciding on a referral.

The core services that map directly onto everything above: 3PL Selection & Diligence for brands vetting overflow or long-term outsourcing partners, Peak & Overflow Capacity planning for seasonal surge decisions, and Fulfillment Cost Benchmarking to pressure-test whether expansion, automation, or outsourcing actually pencils out. Schedule a consult through 3plcowboy’s services page before your next lease renewal or peak season forces the decision for you.
Sources
- Warehouse Capacity Planning: The Complete Guide for 2026
- Calculating Warehouse Capacity: How to Calculate and Maximize Warehouse Space | NetSuite
- Warehouse Capacity Planning Guide for Seasonal Peaks
- Worldwide retail e-commerce sales (Statista)
FAQ
What Are the 5 Key KPIs for a Warehouse?
The five to track for capacity health are occupancy by zone, picks per hour, replenishment response time, dock-to-stock time, and inventory accuracy through cycle counts.
How Do I Calculate My Warehouse’s Capacity?
Multiply usable floor area by clear stacking height to get usable cubic feet, then divide your current inventory volume by that number and multiply by 100 to get your utilization percentage.
What Are the 5 Core Warehouse Processes?
The five core processes are receiving, putaway, storage, picking, and shipping, and a capacity plan has to model throughput limits at each stage, not just total storage volume.