
Cost to serve analysis measures the fully loaded cost of sourcing, storing, transporting, and supporting each customer, SKU, or channel, then nets that cost against revenue to expose who actually makes you money. The verdict it delivers is rarely comfortable: a meaningful slice of “good” customers by revenue are quietly losing money once you allocate warehouse labor, small-order picking, expedited freight, and account service correctly.
A proper cost to serve analysis produces a few concrete outputs fast:
- A ranked list of customers or SKUs by net contribution, not gross margin
- A “whale curve” showing the top tier of accounts carrying disproportionate profit while the bottom tier that erodes it (erodes it)
- Specific cost drivers behind each loss (order size, delivery frequency, service level)
Pro Tip: A quick diagnostic can be scoped and delivered in a few weeks; building a version finance will actually trust and reuse takes longer. None of it matters unless it’s tied to a decision you’re prepared to make: reprice an account, restructure a service tier, or drop a SKU.
Key Takeaways
Cost to serve analysis works because it replaces averaged cost assumptions with activity-based allocations tied directly to pricing, service, and network decisions.
| Point | Details |
|---|---|
| Define decisions first | Name the pricing, service, or network decision before building the model, or the output won’t drive action. |
| Use granular drivers | Track 20 to 50 activity-based allocations to keep outliers visible instead of averaged away. |
| Expect a whale curve | Roughly the top 20 to 30 percent of customers typically carry disproportionate profit while a similar bottom tier erodes it. |
| Reconcile data early | Build a unit-of-measure and period reconciliation table across ERP, WMS, and TMS before allocating any cost. |
| Get a practitioner-led diagnostic | 3plcowboy scopes cost to serve diagnostics using operator-tested allocation logic rather than academic cost theory. |
Table of Contents
- What Is Cost to Serve and How Is It Different From Standard Cost Reporting?
- Why Run a Cost to Serve Analysis in the First Place?
- How Do You Actually Run a Cost to Serve Analysis?
- What Data Do You Need and How Do You Reconcile It?
- What Are the Most Common Cost to Serve Pitfalls?
- A Practitioner’s View on Making Cost to Serve Decision-Grade
- Why the Standard Cost to Serve Playbook Falls Short
- Get a Cost to Serve Diagnostic Built by Someone Who’s Run the Floor
- Frequently Asked Questions About Cost to Serve Analysis
- Sources
What Is Cost to Serve and How Is It Different From Standard Cost Reporting?
Standard P&L reporting bundles logistics costs into overhead and spreads them evenly across customers or products. Cost to serve analysis refuses to average. It builds a cost taxonomy across sourcing, production, warehousing, transportation, inventory carrying, customer service, returns handling, and account management, then assigns each cost to the specific order, customer, or SKU that caused it.
Here’s why that matters: two customers with identical order values can have wildly different cost profiles. One orders in full pallets, once a week, to a single dock. The other splits the same volume into daily small-parcel shipments to six locations with rush requests. Aggregate reporting shows both at the same gross margin. A proper cost-to-serve methodology shows one funding the business and the other draining it.
Typical outputs from this exercise include:
- A customer or SKU whale curve ranked by net contribution
- Cost-per-order and cost-per-line breakdowns by service type
- Scope flexibility across customer, SKU, channel, or order profile, depending on the decision at hand
The scope choice matters as much as the math. A network redesign question needs channel-level granularity; a pricing renegotiation needs account-level detail down to the order.
Why Run a Cost to Serve Analysis in the First Place?
The decisions cost to serve analysis unlocks are specific, not theoretical. You use it to reprice or renegotiate contracts with accounts that look profitable on paper but consume outsized labor and freight. You use it to design service tiers that charge for expedited handling instead of absorbing it. You use it to redesign channel or fulfillment strategy, and to rationalize SKUs that generate revenue but never earn back their handling cost.
Value tends to concentrate in predictable places: long-tail customers with fragmented order patterns, remote delivery locations, and accounts that place frequent small orders instead of consolidated ones. The whale curve pattern documented across practitioner case studies shows that roughly the top 20 to 30 percent of customers generate outsized profit, while a similarly sized bottom tier actively destroys it.
This is where finance and supply chain have to talk to each other. Gross margin says one thing; net contribution after allocated serving costs says another, and the second number is the one that should drive commercial decisions. Cost to serve metrics work best on a recurring cadence, feeding quarterly account reviews and pricing committees, not sitting in a slide deck that gets built once and forgotten.
- Renegotiate or reprice underwater accounts before contract renewal
- Build service tiers with explicit charges for non-standard handling
- Rationalize SKUs whose handling cost exceeds their margin contribution
- Feed net contribution numbers into quarterly account and pricing reviews
How Do You Actually Run a Cost to Serve Analysis?
Running this well is a sequence, not a spreadsheet exercise you improvise. Here’s the order that works.
1. Define the objectives and decisions the model must support. Before you touch a dataset, name the decision. Are you deciding whether to fire a customer, restructure pricing tiers, or justify a network change? Practitioners consistently point to this as the step that determines whether the whole project produces action or just an interesting report.
2. Choose your segmentation and service levels. Decide whether you’re analyzing at customer, SKU, channel, or order-profile level. Segment by service characteristics that actually vary cost: delivery frequency, order size, packaging requirements, geographic zone.
3. Map activities and select allocation drivers. List every activity that consumes cost, receiving, putaway, picking, packing, loading, last-mile delivery, returns processing, account management calls, and assign each a driver that reflects actual consumption. A granular model tracks somewhere between 20 and 50 activity-based allocations to keep outliers visible instead of smoothed away. Choose drivers that are measurable, stable, and defensible under scrutiny, not just convenient.
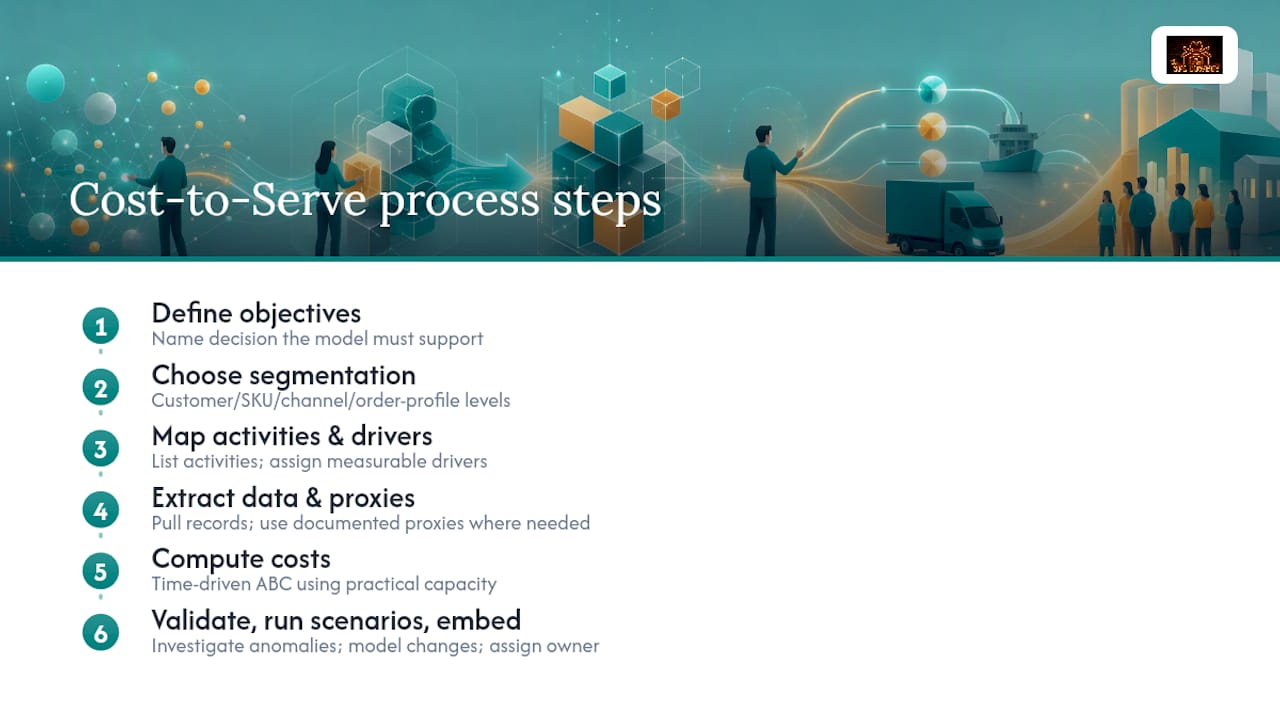
4. Extract the required data and apply proxies where records are thin. Pull order lines, shipment records, warehouse transactions, and labor logs. Where exact time-tracking doesn’t exist, use a documented proxy (average pick time by zone, standard load time by trailer type) and flag it as an assumption rather than pretending it’s measured fact.
5. Compute costs using time-driven activity-based costing. Multiply minutes per activity by a defensible cost-per-minute rate, calculated against practical capacity rather than theoretical full-time capacity. This is the calculation method that scales past a single-department pilot.
6. Validate, sensitivity-check, and investigate anomalies. Run the numbers against operational intuition. If a supposedly great account shows negative contribution, don’t discard the result. Treat it as an investigative lead into data quality, allocation logic, or a real business problem you hadn’t noticed.
7. Run scenarios and quantify the impact of changes. Model what happens if you raise minimum order quantities, shift a customer segment to a different channel, or add a surcharge for expedited orders. A model that can’t answer “what if” questions is a report, not a tool.
8. Assign ownership, set a review cadence, and embed it into finance processes. Someone owns the model. It gets refreshed quarterly, not left to rot after the initial presentation.
What Data Do You Need and How Do You Reconcile It?
The data-gathering phase is the one almost every team underestimates, and it’s usually the difference between a model people trust and one they quietly ignore. You need order lines with SKU-level detail, a SKU master file, shipment records from your TMS, warehouse transactions (picks, puts, and putaway events) from your WMS, labor logs or payroll data, freight invoices, customer service or ticket logs, and sales data broken out by account.
The hard part isn’t collecting these. It’s reconciling them, because ERP, WMS, and TMS systems rarely agree on units. One system counts cases, another counts cartons, a third counts lines. Periods drift too, a fiscal month in finance doesn’t always match a warehouse activity window.
Build a small reconciliation table as your first deliverable, one that maps unit-of-measure definitions and aligns time periods across every source system before a single cost gets allocated. Skipping this step is how models get quietly rejected by the operations team months later.
A few rules that save real time:
- Reconcile transaction volumes across systems before allocating a single cost
- Use practical capacity of roughly 80 to 85 percent of paid labor hours when estimating cost-per-minute rates, so hidden slack doesn’t inflate the figure
- Document every proxy and assumption in plain language so a skeptical stakeholder can trace the logic
- Flag data quality issues explicitly instead of smoothing over gaps
Spreadsheets handle a single snapshot fine. The moment you need recurring, defensible numbers, you’re building an operating model, not a one-off file.
What Are the Most Common Cost to Serve Pitfalls?
Four mistakes show up again and again. Averaging costs across dissimilar order types erases exactly the variation you’re trying to find. Opaque allocation drivers, ones nobody can explain in a sentence, get challenged and dismissed the moment a sales leader disputes an unfavorable result. Treating the analysis as a one-off report guarantees it’s stale within two quarters. And ignoring network effects, like how rationalizing one SKU shifts volume and cost onto its neighbors, produces recommendations that look clean in isolation and backfire in practice.

Validation is what separates a model people act on from one they argue with. Run sensitivity analysis on your top two or three allocation drivers to see how much the ranking shifts. Try an alternative driver for your most contested cost pool and compare results. Cross-check against operational KPIs your warehouse team already trusts, like units picked per labor hour, so the numbers align with what the floor already knows.
Pro Tip: When you present findings, build the deck around impact, recommended decision, implementation steps, an owner, and the metric that will confirm the decision worked. Skip the exhaustive methodology appendix in the main deck; put it in a backup section for the people who ask.
Governance closes the loop. Name a model owner, usually someone sitting between finance and supply chain, set a quarterly refresh cadence, and require sign-off before results get used in pricing or contract conversations.
- Never average costs across meaningfully different order profiles
- Make every allocation driver explainable in one sentence
- Refresh the model on a set cadence, not as a one-time project
- Check network effects before finalizing any SKU or account recommendation
A Practitioner’s View on Making Cost to Serve Decision-Grade
Michael Nooner has spent 17-plus years running operations inside networks most consultants only analyze from a distance, work that included taking a Nike inventory operation from 61% to over 98% cycle count accuracy across more than 450,000 SKUs, delivering over $6 million in annual savings through a pallet-program redesign for Kroger, and leading an eight-month WMS rollout across more than 60 Sysco sites.
That operating background shapes how 3plcowboy treats cost to serve engagements. Allocation drivers get pressure-tested against how the warehouse floor actually behaves, not just how the spreadsheet says it should. Counterintuitive results get investigated before they get presented, because a surprising number is usually telling you something about data quality or real behavior nobody flagged yet.
- Model defensibility comes first: every driver has to survive a challenge from the person who disagrees with the answer
- Stakeholder alignment happens before the final numbers, not after
- A focused diagnostic is the fastest way to see whether the full build is worth the investment
Why the Standard Cost to Serve Playbook Falls Short
Most guidance on this topic treats cost to serve analysis like an accounting exercise: build the model, generate the report, present the whale curve, move on. That’s backwards. The research consistently supports one conclusion: a cost to serve model earns its keep only when it’s built against a decision someone is already prepared to make.
What’s overrated is precision for its own sake. Teams burn weeks perfecting allocation percentages to the second decimal while the account they should have repriced six months ago keeps bleeding margin. What’s underrated is the discipline of documenting every proxy and assumption in plain language. A model nobody can defend in a room full of skeptical sales leaders is a model that gets ignored, no matter how sound the math.
Prioritize this first: pick one decision, one segment, and run the diagnostic fast enough to test whether the answer changes behavior. If it doesn’t, you’ve saved yourself months of building a full operating model nobody will use.
Get a Cost to Serve Diagnostic Built by Someone Who’s Run the Floor
Most cost to serve projects stall because the person building the model has never had to defend an allocation driver to a warehouse manager who knows exactly how long a pick takes. 3plcowboy runs these diagnostics the other way around: allocation logic gets stress-tested against real operating behavior before it ever reaches your pricing committee.

That matters most for brands and 3PLs sitting on messy, multi-system data who need answers fast without commissioning a six-month academic study. 3plcowboy’s advisory work spans 3PL selection and benchmarking, insource versus outsource analysis, and network design, so a cost to serve finding connects directly to a real commercial move, whether that’s a renegotiated contract, a redesigned service tier, or a warehouse network change. If you’re staring at a whale curve you don’t fully trust yet, start a conversation with 3plcowboy about scoping a focused diagnostic.
Frequently Asked Questions About Cost to Serve Analysis
How long does a cost to serve analysis take to complete?
A focused diagnostic typically runs a few weeks. Building a full, maintainable operating model that finance can refresh quarterly usually takes several weeks once you include data reconciliation and stakeholder validation.
What’s the difference between cost to serve and gross margin?
Gross margin subtracts product cost from revenue. Cost to serve goes further, allocating warehousing, transportation, customer service, and account management costs down to the specific customer or SKU that caused them, which is why net contribution numbers often tell a different story than the margin line on a P&L.
Can I run a cost to serve analysis in a spreadsheet?
Yes, for a single snapshot. Spreadsheets get unsupportable once you need recurring, defensible numbers refreshed quarterly across dozens of activity drivers, at which point you need a proper operating model.
What allocation method works best for computing serving costs?
Time-driven activity-based costing, minutes per activity multiplied by a defensible cost-per-minute rate based on practical capacity, is the method most practitioners rely on because it scales beyond a single department pilot.
What should I do if a cost to serve result seems wrong?
Investigate before you dismiss it. A counterintuitive number is usually pointing at a data problem, a flawed allocation driver, or a real business behavior nobody had noticed yet.
Sources
- Supply chain metrics that matter (KPMG)
- Cost to serve analysis: how to reveal hidden losses (AIMMS/AnyLogistix)
- How to Calculate Cost to Serve: Formula and Steps (Cost & Profitability)