
An inventory optimization strategy uses demand data, lead-time variability, and segmentation to hold the right stock in the right locations, cutting carrying cost while protecting service levels. It differs from routine inventory management because it applies models and feedback loops, not fixed reorder habits. Start with a clean item-master and lead-time audit before touching a single reorder point.
TL;DR:
- Inventory optimization is most beneficial for networks with multiple distribution nodes, high SKU variance, seasonal spikes, or recent stockout issues.
- Lead-time variability often exceeds demand fluctuations in driving safety stock needs, making supplier reliability critical to inventory efficiency.
- Multi-echelon optimization can significantly reduce total safety stock by pooling inventory upstream in multi-node networks, provided transportation and response times are sufficient.
- Accurate data on lead times, demand variance, and real service levels are essential; poor master data quality is the leading cause of ineffective implementation.
- Continuous governance, pilot scope control, and alignment with demand and supply planning cycles are vital to sustaining benefits from inventory strategies.
Table of Contents
- What Is Inventory Optimization and Why Does It Matter?
- Which Inventory Control Methods Should You Use First?
- How Should You Forecast Demand for Replenishment?
- How Do You Calculate Safety Stock and Reorder Point?
- When Does Multi‑Echelon Optimization Pay Off?
- How Do You Turn Segmentation Into Working Policy?
- How Do You Roll Out an Inventory Optimization Strategy?
- Which KPIs Actually Tell You the Strategy Is Working?
- What Do Real Rollouts Teach About Quick Wins?
- How Does Inventory Optimization Fit Into S&OP?
- How Do You Build a Cost-Benefit Case for an Inventory Project?
- How Does Inventory Optimization Change Supplier Relationships?
- What Goes Wrong Most Often in Inventory Optimization Projects?
- An Operator’s View on Software Versus Execution
- How 3PL Cowboy Turns Optimization Into Execution
- Sources
What Is Inventory Optimization and Why Does It Matter?
Inventory management keeps the trains running: counting stock, processing receipts, cutting purchase orders on a schedule. Inventory optimization asks a harder question: given real demand variability and real lead times, what is the least capital you need tied up in stock to hit a target service level? SAP frames this as balancing service-level goals against the capital cost of holding inventory, using predictive and optimization models rather than static rules.
The payoff shows up in three places. Carrying cost drops because you stop overstocking slow movers. Stockouts drop because safety stock actually matches demand volatility instead of a guess baked into an old ERP setup. Cash flow improves because working capital that was sitting in a warehouse gets freed up for something else.
Optimization earns its cost fastest in specific situations:
- Networks with multiple distribution nodes, where pooling decisions actually matter
- Catalogs with thousands of SKUs and wide variance in velocity
- Businesses with seasonal spikes that punish static reorder rules
- Any operation where a recent stockout or a bloated warehouse just triggered a budget conversation
If you run a single SKU out of one warehouse with a stable supplier, a spreadsheet and common sense will get you most of the way. Complexity is what makes optimization pay for itself.
Which Inventory Control Methods Should You Use First?
You don’t need every tool in the kit on day one. You need the right one for each segment of your catalog, and most of these techniques pair up rather than compete.
- ABC/XYZ segmentation splits SKUs by revenue or volume contribution (A, B, C) and by demand variability (X, Y, Z). This is the foundation. Everything else, from review frequency to safety stock formulas, should be assigned by segment rather than applied uniformly.
- Economic order quantity (EOQ) calculates the order size that minimizes the combined cost of ordering and holding inventory. It matters most when ordering cost is nontrivial, like freight minimums or supplier setup fees, and less when you’re drop-shipping single units.
- Reorder point (ROP) and min/max rules define when to trigger a replenishment order and how much to order. These are the operational backbone for B and C items where a full statistical model is overkill.
- Safety stock buffers against demand and lead-time uncertainty. This is where most inventory bloat actually hides, and it deserves its own math (more on that below).
- Just-in-time (JIT) minimizes on-hand stock by syncing receipts tightly to consumption. It works well for A items with reliable, low-variability suppliers, and it’s dangerous for anything with erratic lead times.
A practical taxonomy groups these into strategic tools (ABC, MEIO, JIT), operational tools (order management, safety stock, replenishment), and analytical tools (forecasting, tracking, service-level optimization), according to Amazon Business’s inventory guide. Most mature operations run all three layers simultaneously, just tuned differently by segment. JIT for your top sellers with dependable suppliers, min/max for your long tail, and safety stock math calibrated everywhere in between.
How Should You Forecast Demand for Replenishment?
Match the forecasting method to the demand shape, not the other way around. Steady, low-variability items (X-class in an XYZ split) do fine with simple moving averages or exponential smoothing. Items with seasonal or trending patterns (Y-class) need models that capture that structure, like Holt-Winters or ARIMA. Erratic, lumpy demand (Z-class) is where most forecasting tools fail, and where safety stock has to do more of the work than the forecast itself.
Whatever method you pick, measure two things separately: bias (is the forecast systematically high or low?) and variance (how much does it swing?). Mean absolute percentage error (MAPE) is the standard yardstick, and it should directly inform how much safety stock a segment carries. High MAPE items need fatter buffers, not better guessing.
Statistic callout: Ensemble deep-learning models combining MLP, LSTM, and 1D-CNN architectures can improve forecast accuracy for multivariate retail time series, which then feeds more precise safety-stock sizing under an order-up-to-level policy.
Before investing in that kind of machine learning stack, confirm you have clean, granular historical data and engineering resources to maintain it. It’s not worth the setup cost for a catalog where simpler statistical methods already track demand well.
- Include promotional calendars and known demand shocks as explicit model inputs, not noise
- Layer in supplier calendars and known capacity constraints on the supply side
- Reforecast on a cadence that matches your fastest-moving segment, not your slowest
How Do You Calculate Safety Stock and Reorder Point?
The reorder point formula is simple on paper: ROP = (average demand × lead time) + safety stock. The complexity lives entirely in that safety stock term, and lead-time variability usually drives more of it than demand variability does.
A common safety stock formula for normally distributed demand and lead time is:
Safety Stock = Z × σd × √LT
where Z is the service-level factor (1.65 for 95% service, 2.33 for 99%), σd is the standard deviation of demand, and LT is average lead time. When lead time itself varies, the formula expands to account for that variance directly, and it usually pushes the number up substantially.
Here’s the part planners underestimate: a supplier whose lead time swings from 10 to 20 days injects far more uncertainty into your buffer than a demand forecast that’s off by 15%. Lead-time variance frequently drives safety-stock bloat more than demand volatility does, which means tightening supplier reliability can shrink inventory faster than improving your forecast model.
| Scenario | Avg lead time | Lead time std dev | Daily demand std dev | Safety stock (95% service) |
|---|---|---|---|---|
| Stable supplier | 10 days | 1 day | 5 units | Low |
| Variable supplier | 10 days | 5 days | 5 units | Substantially higher |
Before trusting any output, verify three data fields: the actual lead-time distribution (not the number in the PO template), historical demand variance by SKU-location, and your true target service level by segment.
Pro Tip: Pull your last 12 months of actual receipt dates against PO dates before you calculate anything. Most planners are shocked at how wide the real lead-time spread is compared to the number sitting in their ERP master data. For a deeper walkthrough of the math, see the safety stock formula breakdown.
When Does Multi‑Echelon Optimization Pay Off?
Multi-echelon inventory optimization (MEIO) looks at your entire network simultaneously instead of optimizing each warehouse in isolation. SAP describes this as enabling risk pooling upstream, meaning a regional distribution center can carry less total safety stock than the sum of what each downstream location would need on its own, because variability partially cancels out across locations.

The tradeoff is real. Pooling stock upstream improves capital efficiency but adds a transportation leg and a day or two of responsiveness compared to stock sitting at the edge, closer to the customer.
Rules of thumb for when MEIO deployment is worth the modeling effort:
- You operate three or more distribution nodes serving overlapping demand
- Demand across nodes is only moderately correlated, so pooling actually reduces net variance
- Your current safety stock, summed across all locations, looks disproportionate to total throughput
- You have the transportation lanes to move inventory downstream fast enough if a local shortage hits
MEIO tends to deliver the biggest capital-efficiency wins for multi-node networks specifically because it enables those upstream pooling and transfer recommendations. If you’re running two locations with distinct, uncorrelated demand patterns, the math often doesn’t justify the modeling overhead. If you’re running six or more, it usually does.
How Do You Turn Segmentation Into Working Policy?
Segmentation is worthless if it stays in a spreadsheet nobody references at 6 a.m. when a truck is late. The job is translating ABC/XYZ classes into policies your planning system actually enforces.
- A/X items (high value, stable demand) get tight reorder points, weekly or even daily review, and low safety stock relative to volume, since predictable demand needs less buffer.
- C/Z items (low value, erratic demand) get simple min/max rules with wider bands and monthly review, since the cost of a stockout rarely justifies tight management here.
- B/Y items sit in between, typically on a biweekly review cycle with moderate safety stock.
- Exception workflows should flag anything breaching its band automatically, routing only genuine exceptions to a planner instead of burying them in a daily firefighting queue.
Set approval thresholds by dollar impact, not by SKU count, so a planner’s time goes to the handful of decisions that actually move the P&L. Most modern planning systems can automate this policy enforcement directly, applying the matrix at the SKU-location level rather than relying on someone remembering which class a product fell into last quarter.
How Do You Roll Out an Inventory Optimization Strategy?
- Audit data first. Standardize item masters, units of measure, and, critically, real lead times rather than the number in a supplier contract. Small lead-time errors compound into large safety-stock miscalculations, per Cleverence’s rollout guidance.
- Pilot on a bounded scope. Pick one segment (often B/Y items) and one location, run it for 60 to 90 days, and track service level, turns, and forecast error against a control group.
- Scale with integration in place. Confirm the pilot’s rules connect cleanly to your ERP or WMS, document standard operating procedures, and train planners before expanding SKU count.
- Govern it monthly. Assign clear ownership, review dashboards against targets, and adjust parameters based on real outcomes rather than letting the initial settings run untouched for a year.
Pro Tip: Treat the pilot’s success metrics as the same metrics you’ll report in governance reviews later. Switching KPIs mid-rollout is how initiatives quietly lose executive support.
Which KPIs Actually Tell You the Strategy Is Working?
Track a small scorecard, segmented by ABC/XYZ class rather than blended into one company-wide number that hides where the problem actually lives.
- Service level by segment — fill rate targets should differ for A items versus C items, not share one blanket number
- Inventory turns and days on hand — rising turns with stable service level is the clearest sign optimization is working
- Forecast error (MAPE) — trending down validates your forecasting method choice; flat or rising suggests a demand-pattern shift
- Stockout rate — should fall fastest in A/X segments first, since that’s where the tightest policies apply
- Carrying cost as a percentage of inventory value — the bottom-line number that ties the whole exercise to cash
Statistic callout: Time-phased planning models generate explicit trade-off curves showing inventory cost against sales for different target service levels, which gives planners a defensible way to pick a service target instead of guessing at 95% because it sounds reasonable.
Set exception thresholds tighter for A items and looser for C items, and route breaches to a weekly review rather than letting them sit until a monthly meeting.
What Do Real Rollouts Teach About Quick Wins?
Most software rollouts leave default replenishment settings untouched long after go-live. Tuning those defaults to actual lead-time and demand profiles is cheap work with an outsized return, and it’s the first thing worth checking before buying anything new.
- Prioritize cycle counts on A/X SKUs first. That’s where inaccuracy costs the most.
- Re-slot high-velocity items to cut pick-path travel, a fix that pays back almost immediately.
- Enforce ASN discipline with suppliers. Tighter advance-ship-notice accuracy narrows the lead-time variance that inflates safety stock in the first place.
Pro Tip: Rank projects by how fast they free working capital, not by how technically interesting they are. A slotting fix that ships this month beats a forecasting model that ships next year. Tactics like these are covered in more depth in this guide to cycle counting cadence.
How Does Inventory Optimization Fit Into S&OP?
An inventory optimization strategy that lives outside sales and operations planning (S&OP) will drift out of sync with reality within a quarter. S&OP is where demand signals, supply constraints, and financial targets get reconciled monthly, and inventory policy needs to be an explicit input and output of that cycle, not a separate spreadsheet running on its own schedule.
The practical link works both ways. Demand planning feeds the forecast that drives your safety stock and reorder point calculations. In turn, inventory constraints, like a supplier’s lead time stretching from 10 to 20 days, need to flow back into the S&OP conversation so sales and finance aren’t planning against stock levels operations can’t actually deliver.
Companies that treat inventory parameters as static settings, reviewed once a year during budgeting, consistently end up with safety stock that no longer matches current demand volatility or supplier performance. The S&OP cycle is the natural checkpoint to catch that drift, provided inventory metrics show up on the same dashboard as revenue and demand forecasts, not in a separate report nobody in the room has seen.
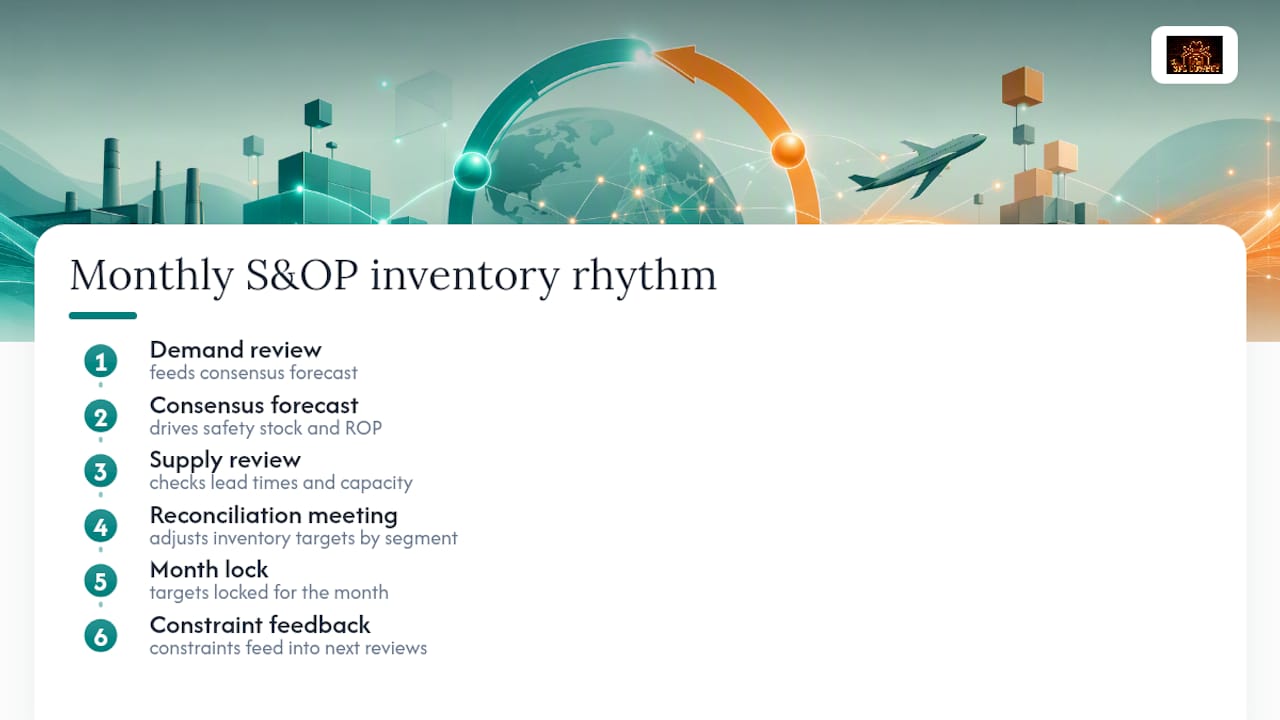
A working rhythm looks like this: demand review feeds a consensus forecast, supply review checks that forecast against current lead times and capacity, and the reconciliation meeting adjusts inventory targets by segment before they’re locked for the month. Skip that last step and your inventory policy is only as current as the last time someone happened to update it manually, which in most operations is longer ago than anyone wants to admit.
How Do You Build a Cost-Benefit Case for an Inventory Project?
The cost-benefit math for inventory optimization has two sides that are easy to compute separately and easy to compare wrong. The cost side includes software or modeling investment, data cleanup labor, and the planner time needed to run pilots and maintain governance. The benefit side includes reduced carrying cost, fewer expedited freight charges from stockouts, and the cash value of working capital released back to the business.
Start with the working capital number, because it’s usually the largest and easiest to defend to finance. If a segment currently carries 45 days of inventory on hand and a tuned safety stock policy brings that to 30 days, the freed capital is a direct, calculable dollar figure tied to your average inventory value in that segment. That number alone often justifies the project before you even count service-level gains.
Stockout cost is harder to pin down precisely, since it involves lost sales and customer goodwill that don’t show up cleanly on a ledger. A defensible approach uses historical stockout incidents, estimates the revenue at risk during each one, and treats the reduction as a probability-weighted benefit rather than a guaranteed number. That keeps the business case honest instead of inflating it with best-case assumptions.
Run the comparison over a full seasonal cycle, not a single quarter, since inventory projects often show their real payback only after the strategy has been tested against a demand peak. A pilot that looks flat in a slow month can look very different once it’s carried a Q4 or back-to-school surge without a stockout.
How Does Inventory Optimization Change Supplier Relationships?
Inventory optimization forces a more transparent conversation with suppliers, because lead-time variance becomes a visible, quantified cost rather than an assumed constant. Once a planning team can show a supplier that their lead time swings by 10 days and that swing is directly inflating safety stock, the conversation shifts from a general request for “faster delivery” to a specific ask: tighter ASN accuracy, more predictable production scheduling, or earlier shipment notifications.
That shift benefits both sides when it’s handled well. Suppliers get clearer, more stable order signals instead of the feast-or-famine purchase order pattern that comes from reactive min/max buying. Buyers get lower safety stock requirements without sacrificing service, because a chunk of the uncertainty that used to require a buffer has been engineered out of the relationship.
Collaboration deepens further when segmentation data gets shared, at least partially, with key suppliers. A supplier who knows which of their SKUs sit in your A/X category understands exactly where reliability matters most to you, and can prioritize capacity or communication accordingly. This is a very different dynamic from a purely transactional PO relationship, where every order looks equally urgent regardless of what’s actually at stake.
The risk worth naming: optimization can strain a supplier relationship if it’s used purely to squeeze order sizes down without any reciprocal transparency. Suppliers who feel like they’re absorbing all the volatility while getting smaller, less predictable orders in return tend to deprioritize that account when their own capacity gets tight. The strongest inventory strategies treat supplier collaboration as part of the optimization, not a byproduct of it.
What Goes Wrong Most Often in Inventory Optimization Projects?
The most common failure isn’t a bad formula. It’s bad inputs feeding a good formula, and a rollout that never gets governed after go-live.
Master data is the first casualty. Item masters with duplicate SKUs, outdated units of measure, or lead times that reflect a contract term rather than actual receiving history will produce confidently wrong safety stock numbers, no matter how sophisticated the model behind them.
The second failure is scope creep in the pilot phase. Teams that try to optimize the entire catalog at once, across every location, rarely finish the pilot with clean enough data to draw a real conclusion. A narrow pilot that actually completes beats an ambitious one that stalls.
The third, and most expensive long-term, is governance abandonment. A policy tuned carefully at launch degrades within a few quarters if nobody reviews it against changing demand patterns or supplier performance. This is exactly the default-settings problem seen across so many software rollouts: initial tuning is done well, then nobody revisits it.
The fix for all three is structural, not technical: assign a named owner for the governance cycle before the pilot even starts, cap pilot scope tightly enough to finish on schedule, and treat the master-data audit as a prerequisite gate rather than a parallel task. Projects that skip that gate tend to discover their data problems only after the optimization model has already produced numbers everyone distrusts.
An Operator’s View on Software Versus Execution
Most inventory optimization failures aren’t modeling failures. They’re execution failures, where a well-built forecast or safety stock formula gets bolted onto operations that never adjusted their actual replenishment habits to match it.
That’s the gap between a consultant’s recommendation and an operator’s rollout. A consultant hands over a model. An operator has to make that model survive contact with a warehouse floor, a supplier who ships late every third order, and a planner who’s been running min/max in a spreadsheet for a decade because it’s familiar. Execution is where the real savings either show up or quietly evaporate.
A retained advisory earns its place when the decision in front of you is expensive to get wrong, like reworking your distribution network, benchmarking a fulfillment partner’s true cost structure, or deciding whether to insource a function you’ve outsourced for years. Software can calculate a reorder point. It can’t tell you whether your current 3PL’s pricing model is quietly working against the inventory strategy you just built.
Before buying another platform, benchmark what your current setup is actually costing you against what good looks like. That comparison usually surfaces more savings than the next software license would.
— Michael
How 3PL Cowboy Turns Optimization Into Execution
Building a safety stock formula is the easy part. Making it hold up against a real supplier, a real warehouse, and a real 3PL contract is where most inventory strategies actually break. 3plcowboy applies underwriting-grade diligence to exactly that gap, running fulfillment cost benchmarking and operations advisory work grounded in direct operating experience, including taking a Nike inventory operation from 61% to 98%+ cycle count accuracy across more than 450,000 SKUs.

If your inventory optimization strategy depends on a 3PL partner’s execution, that partner’s actual cost structure and operational discipline matter more than any formula. 3plcowboy’s 3PL selection and diligence service evaluates candidates the way an underwriter would, not the way a sales call would, and its operations advisory work tunes replenishment execution once the strategy is set. If you’re weighing a network change or a new fulfillment partner alongside your inventory rework, start with a fulfillment cost benchmark to see what your current setup is actually costing you before you commit to anything new.
Sources
- Inventory optimization | Minimizing risk and waste | SAP
- Guide to inventory optimization: Techniques and benefits
- Ensemble deep learning for demand forecasting (ScienceDirect)
- Inventory optimization strategy: Methods, KPIs, and Tools for 2026 (Cleverence)