
BLUF: the fastest, highest-leverage logistics cost reductions come from invoice auditing, consolidation and mode selection, and fixing recurring operational errors. Practitioner data consistently puts those fixes at 8–20% of freight spend, often before you touch a carrier rate sheet. Structural moves, like network redesign and mode conversion, compound those gains but take longer to land.
- Audit invoices first. Billing errors and surcharge creep drain 3–10% of annual freight spend and are usually recoverable within one billing cycle.
- Consolidate before you renegotiate. Converting LCL to FCL or LTL to FTL commonly delivers 15–40% per pallet or per CBM on the lanes it touches.
- Fix the operational leaks. Misdeclared freight classes and mismanaged accessorials are the quiet budget killers most teams never audit.
Key Takeaways
Sustained logistics cost reduction depends on sequencing invoice audits and consolidation first, then layering contract renegotiation, mode conversion, and network redesign on proven savings.
| Point | Details |
|---|---|
| Start with invoice audits | Recover 3–10% of freight spend by reconciling invoices against contracted rates before renegotiating anything. |
| Consolidate before renegotiating | LCL to FCL and LTL to FTL conversions often save 15–40% per pallet or CBM on affected lanes. |
| Measure at the lane level | Track cost per unit and accessorial spend percentage by lane, not blended network averages. |
| Sequence, don’t parallelize | Run quick wins in the first 90 days, contract and technology work by day 180, and network redesign within a year. |
| Get an operator-led benchmark | 3plcowboy applies 17+ years of hands-on fulfillment and network experience to benchmark costs and diligence 3PL decisions. |
Table of Contents
- Where Logistics Cost Reduction Actually Comes From
- Cutting Freight Spend Through Consolidation and Mode Selection
- Reducing Warehouse and Inventory Costs Without Cutting Corners
- Negotiating Contracts and Managing Trade Compliance Costs
- Which Technology Investments Actually Pay Back Fast?
- How to Run a Freight Invoice Audit Program
- A 12-Month Sequence for Sustained Savings
- Cutting the Hidden Cost of Reverse Logistics and Returns
- Packaging Changes That Cut Freight Cost Per Shipment
- Building Contingency Plans That Prevent Cost Spikes
- Sustainability Moves That Cut Cost and Emissions Together
- Editorial Take: Why Sequencing Beats Sophistication
- Where 3plcowboy Fits Into This Playbook
- Sources
Where Logistics Cost Reduction Actually Comes From
Most cost-cutting conversations start with rate negotiation. That’s backwards. Rate cards move the needle a little; operational discipline moves it a lot, and it compounds. Gartner’s supply chain cost research frames this correctly: the durable wins come from treating logistics as a strategic lever, not a line item you squeeze once a year during contract season.
Here’s the ranked order that actually works, based on time-to-impact and typical savings magnitude:
- Freight invoice audit — quick win, impact visible in 30 to 60 days, typically recovers 3–10% of freight spend.
- Load consolidation and zone-skip programs — quick to medium, 60 to 120 days to full ramp, 15–40% per affected lane.
- Accessorial and detention control — quick win, 30 to 90 days, recovers dollars that never should have left the building.
- Mode conversion (truckload to intermodal) — medium term, 90 to 180 days including qualification, up to roughly 30% on qualifying long-haul lanes.
- Contract restructuring with volume-backed data — medium term, tied to renewal cycles, protects margin against surcharge volatility.
- Warehouse slotting and labor productivity fixes — medium term, 60 to 150 days, reduces cost per order handled.
- Network design and facility placement — structural, 6 to 18 months, the largest total dollar impact but the slowest to realize.
- Technology rollout (TMS, freight audit and pay, WMS) — structural, 3 to 12 months depending on scope, but it’s what makes every lever above sustainable instead of a one-time win.
A few things to watch as you work down this list:
- Quick wins fund the business case for structural investment. Show the CFO 8% recovered from invoice auditing before you ask for a WMS budget.
- Every lever needs a baseline metric before you touch it. Cost per unit shipped, cost per order picked, and accessorial spend as a percentage of freight spend are the three numbers that matter most.
- Sequencing beats parallel effort. Teams that try to renegotiate contracts, redesign networks, and roll out a TMS simultaneously usually finish none of them well.
Cutting Freight Spend Through Consolidation and Mode Selection
Transportation is usually the largest line item in a logistics budget, and it’s also where the fastest structural savings hide. Three tactics do most of the work.
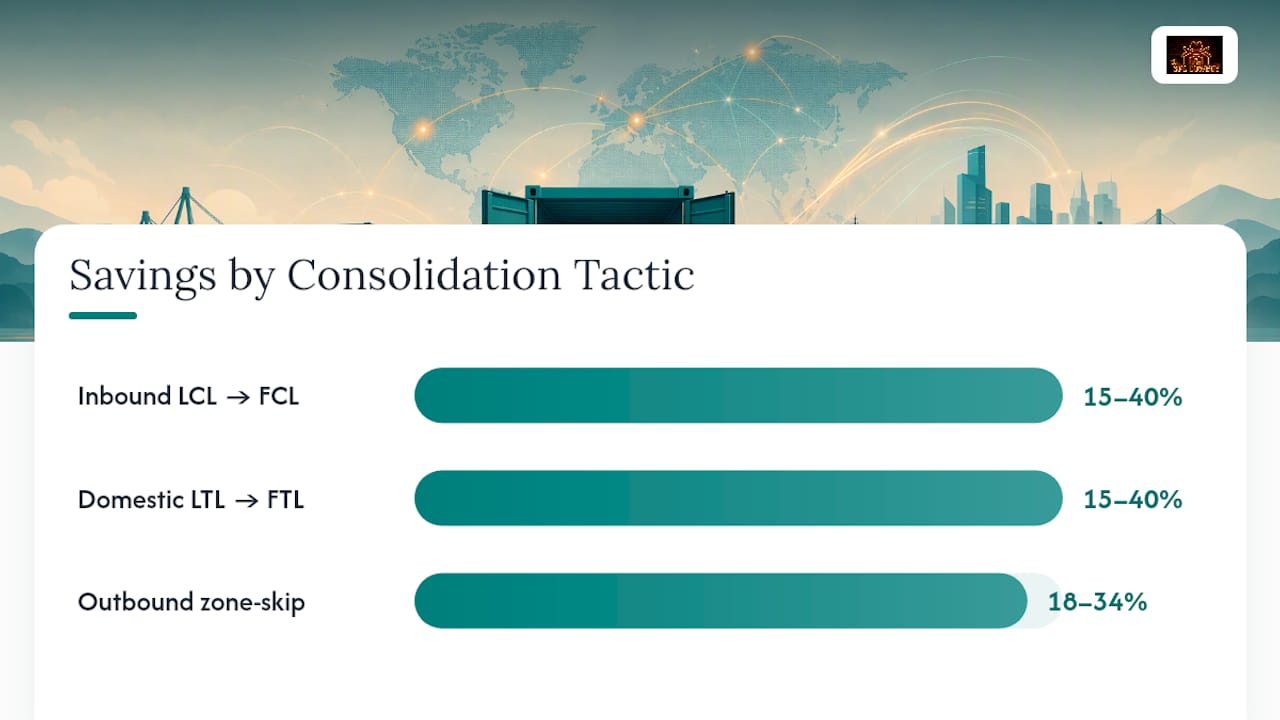
Consolidation converts fragmented, expensive shipments into fuller, cheaper ones. Moving inbound freight from LCL to FCL, or domestic LTL loads into FTL, commonly produces 15–40% savings per CBM or per pallet on the lanes involved. Outbound zone-skip programs, where you truck freight in bulk to a regional sort facility closer to the end customer before final-mile delivery, often land 18–34% reductions per affected lane once volume clears the minimum threshold to justify the model.
Mode conversion shifts freight from over-the-road truckload to rail intermodal wherever transit time allows. Recent freight data shows intermodal saving up to roughly 30% on qualifying long-haul lanes compared to truckload, though the window varies by corridor and fuel price spread. The trigger point is usually lanes over 700 miles with a transit-time tolerance of a day or two.
Load planning rounds out the list: maximizing cube utilization, minimizing empty miles on backhauls, and scheduling pickups to avoid detention windows.
- Run a lane-by-lane audit before committing to any mode shift; not every lane clears the break-even point.
- Measure cost per unit shipped by lane, not blended network averages, since aggregate metrics mask exactly where savings do and don’t materialize.
- Set a 90-day baseline before and after any consolidation change; results on individual lanes often take several weeks to show up cleanly.
Reducing Warehouse and Inventory Costs Without Cutting Corners
Warehouse costs hide in touches, not square footage. Every extra pick, every misplaced SKU, every recount cycle adds labor cost that never shows up on a single line item, just a slowly bloating payroll.

Slotting optimization puts your fastest-moving SKUs closest to pack stations and redesigns pick paths to cut walking distance. This alone frequently cuts labor per order by a meaningful margin without adding a single headcount.
Inventory accuracy matters more than most operators admit. Poor cycle count discipline forces safety stock inflation, which ties up working capital, and it drives expedited shipping when the system says you have stock you don’t. Scanning discipline at receipt and put-away, not just at shipment, closes that gap.
Network decentralization cuts last-mile transportation cost by moving inventory closer to demand, but it inflates total safety stock and working capital across more nodes. It only pays off when the last-mile savings genuinely outweigh the carrying-cost increase, and that math changes by category and order velocity.
- Run a pick-path time study before assuming you need more labor, not after.
- Audit cycle count variance monthly; rising variance is an early warning for expedite costs down the line.
- Compare last-mile savings from a second node against the added inventory carrying cost before signing a lease.
Pro Tip: Before adding a warehouse node, model the carrying cost of duplicated safety stock across both locations. Teams routinely underestimate this by 15% or more because they only price the transportation side of the decision.
Negotiating Contracts and Managing Trade Compliance Costs
Contract structure determines whether your rates stay stable or bleed out through surcharges you never priced in. The discipline here starts before you ever sit across from a carrier sales rep.
Build your negotiating position from 12 months of actual lane-level volume, not projections, and benchmark against public freight indices so you know if the quote in front of you is fair. A well-structured negotiation sets minimum quantity commitments (MQCs) at roughly 80% of realistic forecast volume, which protects you from penalty clauses while still locking in the rate.
Watch for two contract traps that cost more than the base rate ever will:
- Fuel surcharge indexing that resets on outdated benchmarks, quietly padding every invoice regardless of actual fuel cost.
- Vague accessorial schedules that leave detention, liftgate, and residential delivery fees open to interpretation, and therefore open to overcharge.
Trade compliance is the overlooked lever here. Correct HTS classification, smarter country-of-origin sourcing, and duty drawback programs all lower landed cost without touching a single freight rate. Tariff exposure on categories like promotional goods illustrates how classification errors alone can silently inflate landed cost. When tariff volatility or single-source risk gets too high, supplier diversification or nearshoring becomes worth modeling, even if the freight cost per unit looks worse on paper.
Which Technology Investments Actually Pay Back Fast?
Three systems consistently pay for themselves faster than almost anything else in a logistics budget: freight audit and pay platforms, rate management tools, and a transportation management system (TMS) with load planning and real-time visibility. Practitioner data shows these systems often recover invoice errors and speed payables within months, not years of going live.
The mechanism is simple. Automation catches what tired humans miss: duplicate charges, misapplied accessorials, rate discrepancies against contract terms. It also builds the benchmarking data you need to walk into a carrier renegotiation with leverage instead of guesswork.
Once the systems are running, the real value shows up in the dashboards you build on top of them:
- Lane profitability by cost per unit, tracked weekly, not quarterly.
- Accessorial frequency by carrier and by facility, to spot patterns before they become habits.
- Dwell time at both origin and destination, since detention charges are almost always a symptom of a scheduling problem, not a carrier problem.
How to Run a Freight Invoice Audit Program
Most companies leave money on the table simply because nobody is checking the math. Here’s the sequence that works:
- Pull every invoice from the last 90 days across all carriers and modes.
- Reconcile each line against contracted rates, not the invoice total, to catch line-item discrepancies.
- Flag accessorial patterns by carrier and lane, since poor packing geometry and undisclosed requirements often drive recurring detention and reclassification fees.
- File recovery claims on duplicate charges, incorrect reclassifications, and detention or demurrage billed outside the free time window.
- Build a pre-payment audit gate so future invoices get checked before they’re paid, not after.
Add carrier scorecards and service-level agreements once the audit gate is running. That combination turns a one-time recovery into a permanent control, which is the whole point.
A 12-Month Sequence for Sustained Savings
Trying to do everything at once is how most cost-reduction initiatives stall. Sequence it instead.
Days 0 to 90: Run the invoice audit, launch quick consolidation wins on obvious lanes, start a slotting review, and establish baseline KPIs for cost per unit and accessorial spend percentage.
Days 90 to 180: Renegotiate contracts using the audit data as leverage, pilot a TMS or freight-audit platform, and convert qualifying lanes to intermodal.
Days 180 to 365: Tackle network design questions, roll out WMS or TMS at scale, and open strategic supplier or nearshoring windows if trade compliance data supports it.
- Weekly operations review of exceptions and accessorial flags.
- Monthly cost review against the baseline KPIs.
- Quarterly carrier and 3PL performance review tied to the scorecards built in the audit phase.
- Track cost per unit by lane, not blended averages.
- Track accessorial spend as a percentage of total freight spend, month over month.
- Track cycle count accuracy and on-time-in-full rate as leading indicators of hidden cost.
What 17 Years of Operating Data Says About This Playbook
The sequencing above isn’t theoretical. A pallet-program redesign for Kroger delivered $6M+ in annual savings by attacking exactly the kind of operational waste this playbook targets: packaging inefficiency and handling errors compounding across a massive network.
The pattern across every one of these engagements is the same. Teams don’t need a bigger budget. They need someone to walk the floor, find the three or four recurring errors nobody has bothered to fix, and build the discipline to keep them fixed.
Reader teams can run the same diagnostic without hiring anyone: pull 90 days of invoices, walk your own pick paths, and count how many accessorial charges repeat on the same lane or the same SKU.
Cutting the Hidden Cost of Reverse Logistics and Returns
Returns processing is one of the most under-audited cost centers in logistics, largely because it doesn’t show up on the same P&L line as outbound freight. Every returned unit carries reverse transportation cost, inspection labor, restocking or liquidation decisions, and often a second round of packaging.
The highest-leverage fix is reducing the return rate itself through better product information and sizing accuracy at the point of sale, since every return prevented saves the entire cost chain, not just a fraction of it. Beyond prevention, three tactics reduce the cost of the returns that do happen:
- Centralized return processing at fewer nodes cuts labor duplication, even when it adds a bit of reverse transportation distance.
- Automated grading rules route returned inventory to resale, liquidation, or disposal without a person deciding case by case.
- Reverse logistics carriers negotiated separately from outbound contracts, since return volume patterns and service requirements rarely match outbound freight.
Track cost per return processed as its own KPI, separate from outbound cost per unit. Blending the two hides exactly which channel or SKU category is dragging margin down, and it prevents you from seeing whether a packaging or sizing fix on the front end actually moved the needle on the back end.
Packaging Changes That Cut Freight Cost Per Shipment
Packaging is the cheapest lever in this entire playbook to pull, and it’s the one most operations teams never touch after initial product launch. Every cubic inch of wasted void space and every ounce of excess corrugate translates directly into higher dimensional weight charges and lower cube utilization per truck.
Right-sizing packaging to the actual product footprint, rather than a standard box size chosen for convenience, reduces both DIM weight billing and the number of trucks needed to move the same volume of freight. Poor packing geometry is a documented driver of recurring detention and reclassification fees, since oversized or oddly shaped packages slow loading, damage easier, and trigger accessorial charges more often than uniform, well-fitted cartons.
A few concrete moves worth auditing this quarter:
- Run a box-size audit against your top 20 SKUs by volume; most companies find at least two or three sizes that no longer fit the product they’re shipping.
- Evaluate automated cartonization software if you’re still choosing box sizes manually at pack stations.
- Test lighter-weight, higher-strength materials on categories where damage rates are already low, since the freight savings often outweigh the marginal material cost difference.
Packaging changes rarely require capital investment, which makes this one of the fastest levers to test against a real invoice cycle.
Building Contingency Plans That Prevent Cost Spikes
Cost avoidance rarely gets the same attention as cost reduction, but a single unplanned disruption can erase months of audit and consolidation gains in one bad quarter. Port congestion, a single-source supplier failure, or a regional carrier capacity crunch all carry costs that dwarf routine accessorial leakage.
The starting point is mapping single points of failure across your network: one carrier handling 80% of a lane, one supplier producing a critical component, one facility covering an entire region. Each of those concentrations is a cost spike waiting for a trigger event.
From there, build contingency capacity before you need it:
- Dual-source critical lanes and suppliers, even at a slight cost premium, since the premium is cheap insurance against a full network shutdown.
- Pre-negotiate surge capacity with a secondary carrier or 3PL so peak-season or disruption pricing isn’t negotiated under duress.
- Maintain a buffer stock policy for components with long lead times or high supplier concentration risk, sized against actual historical disruption frequency, not a guess.
Contingency planning is the one area where the return on investment is invisible until the disruption happens, and then it’s the only number that matters. Building this discipline alongside the cost-reduction tactics above, rather than after a crisis forces the issue, keeps a single bad week from undoing a year of disciplined savings work.
Sustainability Moves That Cut Cost and Emissions Together
The best sustainability initiatives in logistics aren’t a tradeoff against cost. Route optimization software that reduces empty miles cuts fuel spend and emissions in the same calculation, because they’re the same lever measured two different ways.

Fuel cost management benefits from three tactics that also happen to reduce environmental impact: route optimization to minimize total miles driven, driver behavior programs that reduce idling and harsh braking (both of which burn fuel disproportionately), and fuel hedging contracts that smooth out price volatility for teams running large private fleets. ASCM’s guidance on transportation cost reduction highlights route optimization, driver monitoring, and preventive maintenance as core levers, and each one reduces fuel burn as a direct side effect.
Packaging offers the second overlap. Right-sized, lighter packaging reduces both DIM weight cost and the material footprint of every shipment, and switching to recyclable or reduced-plastic packaging often costs no more than the materials it replaces once volume scales.
A few sustainability moves worth prioritizing specifically because they carry a cost benefit alongside the environmental one:
- Consolidation programs reduce both cost per unit and total truck trips, cutting emissions per shipment as a direct byproduct.
- Intermodal mode conversion cuts fuel burn per ton-mile substantially compared to over-the-road trucking on the same corridor.
- Preventive maintenance programs extend fleet life and reduce the fuel inefficiency that comes with poorly maintained engines.
None of this requires framing sustainability as a separate initiative competing for budget. It’s the same operational discipline this entire playbook is built on, measured with an extra column on the same spreadsheet.
Editorial Take: Why Sequencing Beats Sophistication
Most logistics cost-reduction advice treats every lever as equally urgent, which is exactly backwards. The teams that actually save money don’t run the most sophisticated program. They run the most disciplined sequence, and they resist the urge to chase a network redesign before they’ve closed the invoice-audit leak sitting in plain sight.
The conventional wisdom overweights rate negotiation because it feels like the obvious move. It isn’t. A carrier will give you 2% off a rate card faster than they’ll admit to overbilling you 8% on accessorials, and most shippers never check the second number closely enough to know it’s there.
If I had to pick one place to start, it’s the invoice audit, not because it’s glamorous, but because it’s the only lever that pays for the next one. Use those early recoveries to fund the technology and the network work that actually compounds. Skip the sequencing, and you’ll spend a year chasing structural savings you can’t yet measure, because you never built the baseline to measure them against.
— Michael
Where 3plcowboy Fits Into This Playbook
Running this sequence internally takes real bandwidth, and most logistics teams are already stretched thin managing daily operations. 3plcowboy gives you underwriting-grade diligence on the decisions this playbook depends on, from benchmarking your current fulfillment cost against real market data to evaluating whether your network design still matches your volume.

That’s the same operator lens applied to your invoice audit, your 3PL selection, or your distribution network design, not a generic consulting framework retrofitted to your business.
If your team is trying to decide between fixing what you have and rebuilding it, start with a fulfillment cost benchmarking conversation to see where your numbers actually stand against the market before committing budget either way.
Sources
- How to Reduce Freight Costs: 10 Practical Strategies for Forwarders | GoFreight
- How to build a domestic freight consolidation strategy that cuts shipping costs in 2026 | Ecommerce Times
- Intermodal savings surge up to 49% roi for shippers | FreightWaves