
OTIF improvement comes down to one thing: building a cross-functional, data-first program that combines real-time shipment visibility, disciplined appointment execution, and forecasts that reflect actual demand instead of wishful sales targets. Get those three right and the score moves within a single quarter.
Three moves you can make this week: enforce hard pick-and-load cutoffs so trucks stop leaving late, put safety stock behind your highest-velocity SKUs so a single forecast miss doesn’t trigger a fill failure, and pipe dynamic ETAs into an alert feed so exceptions get flagged hours before a delivery window closes. Statista tracks how frequent global disruptions have become, which is exactly why retailers like Walmart hold suppliers to a benchmark near 98%. Platforms like FourKites exist because visibility, not luck, is what closes that gap.
- Enforce pick-and-load cutoffs with a hard stop, not a suggestion
- Protect top-velocity SKUs with a defined safety stock floor
- Add real-time ETA alerts so exceptions surface before the delivery window closes
Key Takeaways
OTIF improvement succeeds when real-time visibility, appointment discipline, and forecast accuracy operate as one connected system rather than three separate initiatives.
| Point | Details |
|---|---|
| Define OTIF once | Lock in one company-wide formula and delivery-window rule to stop reporting drift. |
| Know your benchmark | Treat 95% as strong performance; retailers like Walmart push suppliers toward 98%. |
| Fix discipline before tech | Dock cutoffs and appointment confirmations often outperform new software in month one. |
| Diagnose before you patch | Map failures to root causes, since most OTIF misses stack across several functions at once. |
| Govern the gains | Run weekly OTIF reviews with root-cause tickets so fixes don’t quietly reverse. |
Where to Learn More About OTIF Strategy
- Statista’s disruption tracking for context on why OTIF risk keeps rising
- FourKites’ OTIF guide for visibility deployment examples
- DHL’s OTIF playbook for warehouse-level operational fixes
- LogiNext’s operational guide for routing and dispatch tactics
Table of Contents
- What Is OTIF and How Do You Calculate It?
- What Counts as a Good OTIF Score?
- Why Do OTIF Scores Actually Fall?
- What Should You Fix First, and What Comes Later?
- Which Systems Actually Move OTIF, and Which Are Optional?
- How Do You Keep OTIF Gains From Slipping Back?
- What Does a Real OTIF Turnaround Look Like?
- What Actually Moves OTIF, and What’s Overrated?
- Frequently Asked Questions
- Sources
What Is OTIF and How Do You Calculate It?
OTIF stands for On-Time In-Full: a shipment counts only if it arrives within the agreed delivery window and contains the full ordered quantity. Miss either condition and the whole order fails, even if 95% of the units showed up on time. The standard formula is straightforward: divide the number of orders delivered on time and in full by total orders shipped, then multiply by 100.
The tricky part is the fine print. Does “on time” mean the exact appointment slot, or a two-hour window? Does an early delivery count as a fail? Most retailers say yes. Pick one internal definition and apply it everywhere, or your OTIF number will drift depending on who’s running the report.
A few terms worth locking down:
- OTD (On-Time Delivery): timing only, ignores fill rate
- ASN (Advance Ship Notice): the EDI message that tells a customer what’s coming and when
- POD (Proof of Delivery): the signed or scanned confirmation that closes the loop
- SLA (Service Level Agreement): the contractual target you’re actually being measured against
Ambiguity here is the single most avoidable cause of reporting disputes with retail partners.
What Counts as a Good OTIF Score?
Anything below 85% signals a systemic problem, not a bad week. The 85 to 94% range is “improving but exposed,” and 95% and above is where most large retailers expect suppliers to sit. Walmart has publicly pushed vendors toward roughly 98%, and the Wall Street Journal reported the retailer tightening delivery demands specifically to push that number higher across its supplier base.
Chargebacks are where this gets expensive. Many retail contracts now dock a percentage of invoice value per late or incomplete shipment, and those penalties compound fast at scale. Set your internal target slightly above whatever the contract requires, since:
- Your own operational buffer needs room for the disruptions Statista tracks
- Negotiated SLA terms should reflect your actual lead times, not aspirational ones
- Retailer targets and internal targets rarely need to be identical, just aligned
Why Do OTIF Scores Actually Fall?
Every OTIF miss traces back to a specific failure mode, and most operations have three or four repeat offenders. Iter Consulting’s analysis found that failures rarely stem from one broken process. They stack up across planning, inventory, and commercial teams that aren’t talking to each other.
Here’s how the common ones map to fixes:
- Inaccurate demand forecasts → segment forecasting by SKU velocity and rebuild the model quarterly, not annually
- Unrealistic delivery promises → require sales and planning sign-off before any lead time commitment goes to a customer
- Pick and pack errors → re-slot the warehouse by pick frequency and add barcode verification at pack-out
- Staging and loading delays → set a hard cutoff time and staff the dock to meet it
- Carrier and appointment failures → enforce carrier SLAs with financial teeth and keep a backup carrier on standby
- ASN/POD mismatches → automate the ASN trigger off the actual pack confirmation, not the order entry
- SKU complexity → rationalize slow-moving variants that eat warehouse capacity disproportionately
The root cause underneath most of these is misalignment: commercial teams promise delivery windows that operations never agreed to, and nobody owns the gap.
What Should You Fix First, and What Comes Later?
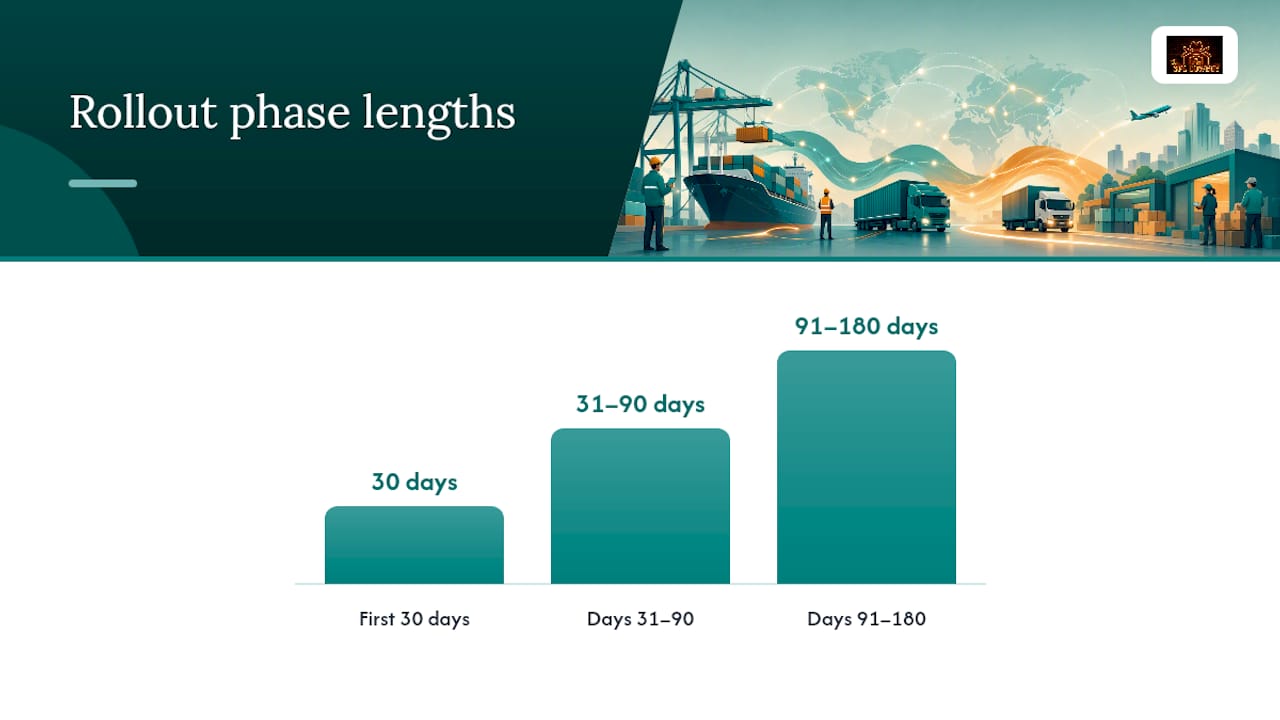
Treat this as a staged rollout, not a wish list. Attack cheap, fast fixes first, then move into structural changes once the quick wins prove out.
The first 30 days should focus on discipline, not technology:
- Lock in hard staging and loading cutoffs at every facility
- Require appointment confirmations 24 hours ahead for every outbound load
- Build safety stock buffers around your highest-revenue, highest-risk SKUs
Days 31 to 90 are where you restructure the workflow:
- Re-slot pick and pack layouts based on actual order frequency, not historical habit
- Rewrite carrier SLAs with defined on-time performance thresholds and penalties
- Segment demand forecasts by customer, region, and SKU tier instead of one blended number
Days 91 to 180 cover the heavier lifts:
- Reassess network design, including whether a second distribution node cuts transit-time risk
- Rationalize SKUs that consume disproportionate warehouse labor for their sales volume
- Optimize TMS and WMS configurations so routing and slotting decisions happen automatically
Prioritize by impact against effort. A dock cutoff policy costs nothing and can move OTIF two or three points in a month. Network redesign might be worth ten points, but it takes a year and real capital.
Track these numbers weekly at minimum, daily if your volume supports it: OTIF broken out by customer, vendor, SKU, and route; ETA accuracy against actual arrival; first-attempt delivery rate; on-time pick completion; and carrier on-time performance by lane. LogiNext’s research points to dynamic routing and automated dispatch as two of the more reliable levers once the basics are in place.
Pro Tip: Force a time-stamped handover audit trail at every dock door, whether it’s a photo of the loaded trailer or a digital POD confirmation. Disputes with carriers and retailers usually die the moment you can produce a timestamp.
Which Systems Actually Move OTIF, and Which Are Optional?
Real-time visibility platforms like FourKites and MacroPoint exist to solve one specific problem: catching a delay before it becomes a customer-facing failure. FourKites documents how feeding live milestone data into exception workflows lets teams intervene hours ahead of a missed window, and cites measurable OTIF gains among customers who deployed it. The value isn’t the GPS ping; it’s what your team does with the alert.
Beyond visibility, three other categories matter:
- WMS/TMS platforms: govern slotting, routing, and load planning at the operational level
- Appointment management tools: reduce dock scheduling conflicts that stack up into carrier delays
- Analytics and BI dashboards: turn raw OTIF data into root-cause breakdowns your team can act on
Decide buy versus build on three criteria: how fast you need it live, how well it integrates with your existing EDI and ASN feeds, and whether the vendor already covers your carrier base. Building in-house rarely wins on speed. Before piloting anything, confirm the vendor can ingest your current ASN format without a six-month integration project. DHL’s own guidance backs this up, pointing to digitized tracking and time-slot management as two of the highest-leverage, lowest-cost improvements available to most operations.
How Do You Keep OTIF Gains From Slipping Back?
Chart OTIF trend lines by cohort, plus a root-cause breakdown and an SLA risk pipeline, so a dip gets caught before it becomes a quarter-long slide.
Run a daily ops huddle on exceptions, a weekly OTIF review with logistics leads, and a monthly steering session that includes commercial. Every repeat failure needs a ticket and a corrective action plan; if the same root cause appears twice, it’s a process gap, not a fluke.
What Does a Real OTIF Turnaround Look Like?
Within 30 days: hard dock cutoffs and mandatory appointment confirmations. Within 90: carrier SLA rewrites and a safety stock policy tied to sales velocity, not historical averages.
- Baseline: 81% OTIF, concentrated failures in two carrier lanes and a handful of SKUs
- Intervention: dock discipline, carrier SLA enforcement, targeted safety stock
- Result: sustained OTIF gains into the low 90s within two quarters, without new headcount
The fastest OTIF gains rarely come from new software. They come from enforcing rules that already existed on paper but nobody was holding anyone to.
here once available. The pattern above tracks the same 30/90/180 roadmap outlined earlier: fix discipline first, structure second.
What Actually Moves OTIF, and What’s Overrated?
Most OTIF advice overweights technology and underweights discipline. A visibility platform tells you a shipment is late. It doesn’t fix why your dock team let it leave two hours behind schedule in the first place. The operators who move OTIF fastest fix the boring stuff first: cutoffs, appointment confirmations, safety stock on the SKUs that actually drive revenue.

Where conventional advice falls short is treating OTIF as a logistics-only metric. It isn’t. A sales team promising a delivery window operations never agreed to will sink your score faster than any carrier delay. Cross-functional alignment on what’s actually deliverable matters more than any dashboard.
Prioritize the roadmap in order: fix discipline in 30 days, restructure workflows in 90, and only then invest in network redesign or new tooling. Skipping ahead to technology before the fundamentals are solid is the most common and most expensive mistake in this space.
Frequently Asked Questions
What is a good OTIF percentage for a mid-size supplier?
Most operations should target 95% or higher.
How fast can OTIF improvement show measurable results?
Discipline-focused fixes like dock cutoffs and appointment confirmations can move the number within 30 days. Structural changes like network redesign or SKU rationalization typically take two quarters or more.
Does OTIF improvement require new software?
Not immediately. The highest-leverage first moves are operational: staging discipline, safety stock on high-risk SKUs, and appointment enforcement. Visibility tools like FourKites or MacroPoint add value once those basics are solid.
How is OTIF different from OTD?
OTD measures timing alone. OTIF requires both on-time arrival and complete order fulfillment, so a shipment that’s on time but short on quantity still counts as a fail under OTIF.
Sources
- Statista — Supply chain disruptions worldwide
- Iter Consulting — OTIF performance: root causes & systemic fixes for supply-chain leaders