
Fix five things in this order: clean your transaction and promotion history; measure accuracy at the SKU-location-week level; run a monthly consensus cycle with a named owner; add causal signals for your top-volatility items; and pilot AI only on exceptions. Teams that follow this sequence typically see 3 to 7 MAPE points of improvement and a measurable drop in emergency shipments within two quarters, according to an experienced supply chain operator with a track record of running inventory and planning turnarounds at major companies.
TL;DR:
- Focus on improving data hygiene by integrating point-of-sale, SKU-level order history, inventory positions, promotion calendars, and external signals before deploying advanced models.
- Implement a monthly cycle that generates a statistical baseline, incorporates commercial overlays, and measures forecast accuracy at the SKU-location-week level.
- Use ensemble forecasting methods and causal demand sensing to capture physical signals like weather and inventory trends, especially for volatile or external-driven SKUs.
- Measure forecast improvements with metrics like MAPE, bias, and Forecast Value Added at a granular level, linking accuracy improvements directly to inventory and cost savings.
- Build demand plans that drive supply decisions explicitly, with clear escalation paths for issues and organizational ownership, and prioritize data fixes before AI investment.
Table of Contents
- What Are the Core Components of Effective Demand Planning?
- What Does the Monthly Demand Planning Cycle Look Like?
- Which Forecasting Techniques Actually Improve Accuracy?
- How Do You Measure Whether Demand Planning Is Improving?
- How Does Demand Planning Connect to S&OP and Supply Decisions?
- What Organizational Changes Support Better Forecasts?
- Where Should You Invest in AI for Demand Planning?
- What’s a Realistic 90-Day Plan for Demand Planning Improvement?
- What Do Real Demand Planning Transformations Actually Look Like?
- What Do 17 Years of Operating Experience Say About Demand Planning?
- How 3plcowboy Helps You Fix Demand Planning at the Root
- Sources
What Are the Core Components of Effective Demand Planning?
Demand planning improvement starts with structure, not software. Before any statistical model or AI layer earns its budget, a planning function needs four things working correctly: clean inputs, a separated baseline and overlay process, a documented promotion calendar, and a governance rhythm that forces someone to own the final number.
Data hygiene is the unglamorous part everyone skips and everyone regrets skipping. Your model is only as good as what feeds it, and most planning teams pull from sources that were never designed to talk to each other.
The high-value sources worth wiring in first:
- Point-of-sale data, which reflects actual consumer demand rather than distorted order patterns.
- Order history at the SKU-location level, not aggregated regional totals.
- Current inventory positions across every node, so the system knows what’s already in the pipeline.
- Promotion calendars with lift assumptions attached, not just start and end dates.
- External signals like weather indices or macro indicators for categories where they matter.
Separating the statistical baseline from commercial overlays matters because it isolates what the math says from what a sales manager believes. A structured demand planning function generates a clean baseline first, then layers in known future events, then reconciles the two in a documented consensus step. Every cycle should publish three artifacts: the baseline, the overlay adjustments with rationale, and the final consensus plan that supply and finance both sign off on.
What Does the Monthly Demand Planning Cycle Look Like?
A repeatable cadence beats a brilliant one-off forecast every time. Here’s the sequence that works across most mid-size to enterprise operations:
- Generate the statistical baseline early in the month, using history cleaned of stockout distortions and one-time anomalies.
- Collect commercial overlays from sales, marketing, and category managers, each overlay tagged with a reason code.
- Hold the demand review meeting where planning, sales, and finance reconcile the baseline against overlays and challenge outliers.
- Publish the consensus plan at the SKU-location-week level, the finest grain that still supports real decisions without drowning planners in noise.
- Measure the prior cycle’s accuracy before building the next baseline, so errors get diagnosed instead of repeated.
New products and promotions get folded in during step two, using analog forecasting for launches (matching a comparable historical SKU) and documented lift factors for promotions rather than gut-feel bumps. Running this cycle at the decision level, instead of a coarser category or national view, is what lets procurement and production actually act on the output instead of translating it themselves.
Which Forecasting Techniques Actually Improve Accuracy?
Not every method deserves equal trust, and the research backs a specific approach: combine multiple forecasting methods and apply structured checklists rather than betting on one favorite algorithm. J. Scott Armstrong and Kesten Green’s evidence-based forecasting work documents 17 methods and five selection checklists, and their core finding is that ensembling several reasonable methods consistently beats chasing one sophisticated model.
Causal demand sensing is the other lever that moves the needle for demand driven by real-world events rather than pure sales momentum. Instead of reading last month’s sell-through, you forecast the physical drivers behind it:
- Weather patterns for seasonal or climate-sensitive categories.
- Installed base data for consumables and replacement parts.
- Retailer inventory positions, which often lead consumer sell-out by weeks.
Rebuilding a planning process around these physical signals shifts your triggers from lagging sales reports to leading indicators, which cuts emergency freight and excess safety stock.
Intermittent demand and new products need different treatment entirely. Blend a Croston-style method for sparse, spiky SKUs with analog forecasting for launches, and never force a single model architecture across your whole portfolio.

Pro Tip: Run a quarterly “method bake-off” on your top 20 SKUs by revenue, testing at least three forecasting methods against actuals. The winner changes more often than most planners expect.
How Do You Measure Whether Demand Planning Is Improving?
You can’t fix what you don’t measure at the right level. Mean Absolute Percentage Error (MAPE) and Mean Absolute Scaled Error (MASE) tell you how far off the forecast ran, while bias tells you whether it’s consistently high or low, which matters more for inventory planning than raw error.
Forecast Value Added, or FVA, answers the question that actually determines where to spend your improvement budget: did the human override the baseline and make it better, or worse? Measuring accuracy at the SKU-location-week decision level, rather than an aggregated view, exposes exactly where planner judgment adds value and where it should be constrained.
| Metric | What it tells you | Review cadence |
|---|---|---|
| MAPE / MASE | Overall forecast error magnitude | Monthly, per SKU-location |
| Bias | Systematic over or under-forecasting | Monthly |
| Forecast Value Added | Whether overlays improve the statistical baseline | Every cycle |
Every point of MAPE improvement on a high-volume SKU set can translate directly into fewer stockouts and lower carrying costs, though the dollar value depends on your specific margin and holding-cost structure. Pair your FVA dashboard with a safety stock formula that ties buffer levels directly to measured forecast error rather than a flat percentage, and you’ll see the financial impact of accuracy gains show up on the balance sheet, not just in a planning report nobody reads.
How Does Demand Planning Connect to S&OP and Supply Decisions?
A consensus demand plan is worthless if procurement and production quietly override it with their own spreadsheets. The plan has to be the single number that drives reorder points, production schedules, and allocation decisions, full stop.
That means building explicit rules for what happens when supply can’t meet the plan:
- Define scenario triggers for constrained supply (a key supplier delay, a capacity ceiling) before you need them, not during the crisis.
- Tie the consensus number directly into your reorder point calculations, so lead time and demand variability both feed the buffer, not just the forecast mean.
- Give planning and supply clear decision rights: planning owns the demand number, supply owns feasibility, and disagreements escalate to a named executive within 48 hours, not the next monthly meeting.
Without that escalation path, disputes just fester in email threads while inventory drifts out of alignment with what customers actually want.
What Organizational Changes Support Better Forecasts?
Technology fixes nothing if the people and meetings around it are broken. A functioning demand planning organization needs planners who understand both statistics and the commercial story behind the numbers, plus a RACI that makes ownership unambiguous.
The monthly cycle needs one accountable owner for the consensus number, typically the demand planning lead, with sales and finance as consulted stakeholders rather than co-owners who can override the plan after the meeting ends.
- Set data refresh SLAs (POS and order data current within 24 to 48 hours of the review meeting).
- Name a single owner of the published consensus plan, with authority to reject unsupported overlays.
- Run a quarterly retrospective specifically on FVA results to catch planners whose overlays are eroding accuracy.
Human overlays degrade forecasts more often than teams admit, usually when a planner adjusts every single cycle regardless of what the data shows. If a planner’s overrides consistently score negative on FVA, that’s a training gap, not a data gap.
Pro Tip: Rotate the “devil’s advocate” role in your demand review each month. Whoever holds it has to challenge the largest overlay adjustment on the table before the meeting closes.
Where Should You Invest in AI for Demand Planning?
AI earns its place on five specific jobs, not as a wholesale replacement for the planning process. Automatic per-SKU model selection typically adds 3 to 7 points of MAPE improvement across a mixed portfolio, while machine learning applied to volatile, externally-driven SKUs can add another 5 to 12 points on that narrower slice.
The five capabilities worth piloting, in rough order of proven value:
- Automatic model selection across a large SKU catalog, instead of one method forced on everything.
- Machine learning specifically for volatile, promotion-heavy, or weather-sensitive SKUs.
- Integration of external driver data directly into the forecast engine.
- Exception detection that flags only the SKUs needing planner attention instead of surfacing every line item.
- Conversational assistants that let planners query forecast drivers in plain language.
Explainability isn’t optional here. A model that can’t show why it moved a forecast gets rejected by planners within a quarter, no matter how accurate it tests in isolation. Scope your pilot narrowly: pick 50 to 100 high-volatility SKUs, define success as a MAPE improvement threshold agreed in advance, retrain quarterly, and check integration with your existing AI-driven forecasting stack before scaling further.
What’s a Realistic 90-Day Plan for Demand Planning Improvement?
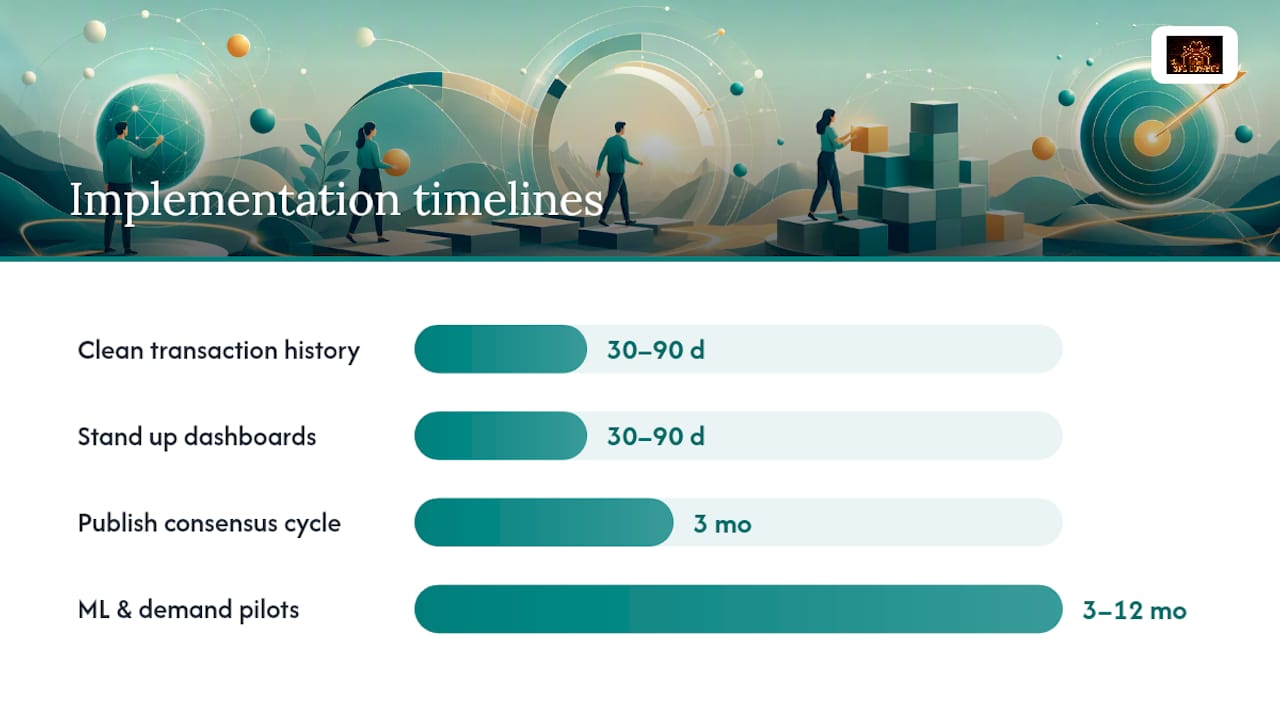
Sequence matters more than ambition. Trying causal sensing and machine learning before your data is clean just automates the mess faster.
30 to 90 day quick wins:
- Clean 12 to 24 months of transaction history, removing stockout-distorted periods (owner: demand planning lead; metric: percentage of history flagged and corrected).
- Stand up MAPE, bias, and FVA dashboards for your top 20% of SKUs by revenue (owner: analytics; metric: dashboard live and reviewed monthly).
- Publish a documented monthly consensus cycle with named roles (owner: planning manager; metric: cycle completed on schedule three months running).
3 to 12 month projects:
- Pilot causal demand sensing on your most weather- or event-sensitive category (owner: demand planning lead; metric: MAPE improvement on pilot SKUs).
- Run an ML model pilot on your 50 to 100 most volatile SKUs (owner: planning plus IT; metric: MAPE improvement against baseline).
- Integrate promotion planning directly into the baseline overlay process (owner: commercial planning; metric: reduced promo forecast bias).
Pro Tip: Don’t run more than two medium-term projects at once. Teams that try causal sensing, an ML pilot, and a new S&OP tool simultaneously usually finish none of them well.
What Do Real Demand Planning Transformations Actually Look Like?
Public case data backs the process-first sequence. Amway’s planning transformation with o9 delivered 4 to 5 points of accuracy improvement and cut review cycle time substantially, but only after the team invested heavily in data cleansing and hierarchy design first. Bayer followed a similar path, integrating retailer sell-in and sell-out data and customizing its planning platform before layering in touchless forecasting.
The pattern across both is consistent: the accuracy gains showed up after data harmonization and process redesign, not because a new algorithm arrived. Teams that skip that groundwork and buy a forecasting platform first tend to automate their existing errors at scale.
Common failure modes worth naming directly:
- Rolling out new software before fixing the underlying data hierarchy.
- Measuring accuracy only at an aggregated category level, hiding where the real error lives.
- Letting planner overlays run unchecked because nobody measures FVA.
What Do 17 Years of Operating Experience Say About Demand Planning?
Process before tech is the most common failure I see, and it’s not close. Companies buy a forecasting platform hoping it fixes a data problem, and six months later they have the same bad number dressed up in a nicer dashboard.
At Kroger, the leverage wasn’t a new model. It was fixing a pallet program that had been quietly distorting order patterns for years, which contributed to $6 million in annual savings once the underlying data reflected reality.
If you can’t measure Forecast Value Added on your current process, you’re not ready for AI. Fix the data. Measure the baseline. Then invest.
— Michael
How 3plcowboy Helps You Fix Demand Planning at the Root
This operator-led advisory approach offers an alternative to hiring generalist consultants or relying solely on software vendors for supply chain improvement budgets. The difference: every recommendation gets tested against real fulfillment cost and inventory data before it reaches your leadership team, because this same evidence-based diligence applies across both forecasting and logistics advisory work.

If your demand plan keeps missing and nobody can say exactly why, a fulfillment cost benchmarking engagement shows you the dollar impact of your current forecast error before you spend a cent on new tools. For teams facing bigger structural questions, whether that’s capacity constraints, a 3PL search, or a network redesign triggered by better demand visibility, the supply chain assessment service maps the whole picture. Reach out for a diagnostic conversation and find out exactly where your forecast error is costing you money.
Sources
- J. Scott Armstrong & Kesten C. Green — Demand Forecasting (evidence-based methods)
- Supply Chain Management Review — Rebuilding a planning function around the physical world
- SupplyChainBrain — How AI is transforming demand planning at Bayer
- Trace Consultants — How to build a demand planning function that actually works