
The inventory reorder point is the stock level that triggers a new purchase order before you run out. The working formula is ROP = (Average daily demand × Lead time) + Safety stock. Anything more complex builds on that line. The examples below, and a probabilistic version for volatile demand, come next.
TL;DR:
- Accurate demand and lead time data are essential, with lead times measured from purchase order placement to stock being available, not just truck arrival.
- The probabilistic safety stock formula accounts for demand variability and target service level, requiring standard deviation and Z-scores for precision.
- Reorder points should be recalculated frequently for high-value SKUs and less often for slow-moving items to avoid stockouts or excess inventory.
- System setup, data accuracy, and demand segmentation are common pitfalls that cause misfires, highlighting the importance of ongoing governance.
- Automated or manual order triggers depend on SKU value and supplier reliability, with high-dollar or new suppliers typically requiring human review before PO creation.
Table of Contents
- What Is an Inventory Reorder Point, and Why It Matters
- How to Calculate the Inputs: Demand, Lead Time, and Safety Stock
- The Exact Reorder Point Formulas: Basic and Probabilistic
- Two Worked Examples You Can Copy Into a Spreadsheet
- Setting Up Reorder Points in Your ERP or WMS
- How ROP and EOQ Work Together
- Common Reorder Point Mistakes and How to Fix Them
- What Operator Experience Adds to the Formula
- When to Use ROP Versus Other Replenishment Approaches
- How 3plcowboy Helps Fix Reorder Point Problems Before They Cost You
- Where to Verify the Formulas Yourself
- Sources
- FAQ
What Is an Inventory Reorder Point, and Why It Matters
The reorder point, sometimes called the reorder level or ROL, marks the on-hand quantity that should fire off a replenishment order. It’s a trigger, not a target. Confusing the two is where a lot of inventory planning goes sideways.
ROP governs when you order. It has nothing to do with how much you order, that’s the job of your order quantity logic, whether that’s economic order quantity (EOQ), a fixed lot size, or a supplier minimum. Treat them as separate decisions and your replenishment math stays clean.
Get the trigger right and a few things improve at once:
- Stockouts drop, because you’re ordering before the shelf goes bare, not after.
- Carrying costs stay in check, because you’re not padding every SKU with arbitrary buffer stock “just in case.”
- Fill rate climbs, since orders ship complete instead of backordered.
- Cash stops sitting idle in inventory that arrived weeks before it was needed.
Get it wrong in either direction and the cost shows up somewhere. Set the ROP too low and you eat stockouts, expedited freight, and lost sales. Set it too high and you tie up working capital in stock that just sits there depreciating or aging out. The reorder point is the lever that balances both risks, which is exactly why it deserves more attention than a spreadsheet formula slapped in once and forgotten.
How to Calculate the Inputs: Demand, Lead Time, and Safety Stock
Every reorder point calculation lives or dies on three inputs, and most bad ROPs trace back to one of them being sloppy.
Average daily demand comes from historical sales or consumption data, sliced by SKU, not blended across your whole catalog. A fast mover and a slow mover in the same product line will have wildly different demand curves, and averaging them together produces a number that’s wrong for both.
Lead time is measured from the moment you place the purchase order to the moment stock is put away and available to pick, not just “when the truck shows up.” That distinction matters more than most planners assume, as outlined in Amazon inventory management best practices for marketplace sellers.
- Pull your last 10 to 20 purchase orders for the SKU and record PO date, ship date, and putaway date.
- Separate transit time from dock-to-available time, since receiving and quality checks can add days you’re not currently counting.
- Sample across order sizes, because a supplier that ships a small reorder in 5 days might take 12 for a full container.
- Calculate both the average lead time and its variability (standard deviation), since the second number determines how much safety stock you actually need.
Safety stock can be built three ways, depending on how much precision your operation needs. A fixed buffer of days’ supply works fine for stable, low-risk SKUs. The max-avg method, (max daily sales × max lead time) minus (average daily sales × average lead time), gives a more defensible buffer without needing statistical software, as inFlow Inventory outlines. For anything with real demand volatility or supplier inconsistency, a probabilistic service-level method is worth the extra math.
Pro Tip: When you’re surveying lead times during a system rollout, capture supplier cutoff times and carrier pickup windows separately from transit days. Those hidden gaps are usually where measured lead-time variability quietly inflates.
The Exact Reorder Point Formulas: Basic and Probabilistic
The basic formula handles most stable, predictable SKUs just fine: ROP = (Average daily demand × Lead time) + Safety stock, as NetSuite lays out in its ROP guide. If your demand doesn’t swing much and your supplier ships like clockwork, this line is all you need. Don’t overbuild the math for a SKU that doesn’t demand it.
For SKUs with real variability, either in demand or in lead time, the probabilistic version accounts for that uncertainty directly rather than papering over it with a flat buffer:
SS = Z × σd × √LT
ROP = (D × LT) + SS
Here’s what each variable means:
- D = average daily demand
- LT = average lead time in days
- σd = standard deviation of daily demand (how much demand actually bounces around)
- Z = the Z-score tied to your target service level
- SS = safety stock, and ROP = the full reorder point
The Z-score is the piece most planners skip past without understanding, and it’s worth pausing on. A Z of 1.65 corresponds to roughly a 95% service level, meaning you’ll stock out on that SKU about 5% of replenishment cycles. Push to a 99% service level and Z climbs to about 2.33, which raises your safety stock substantially, since the relationship isn’t linear. SupplyChainMath’s worked guide walks through this scaling in more detail if you want to see it applied across multiple service-level targets.
One caution: this formula is only as good as your σd. If you’re calculating standard deviation off eight data points because the SKU is new or slow moving, the number is close to meaningless, and you’re better off using the max-avg method or a flat buffer until you have enough history to trust the statistics. Garbage variance data produces a safety stock number that looks scientific and isn’t.
Two Worked Examples You Can Copy Into a Spreadsheet
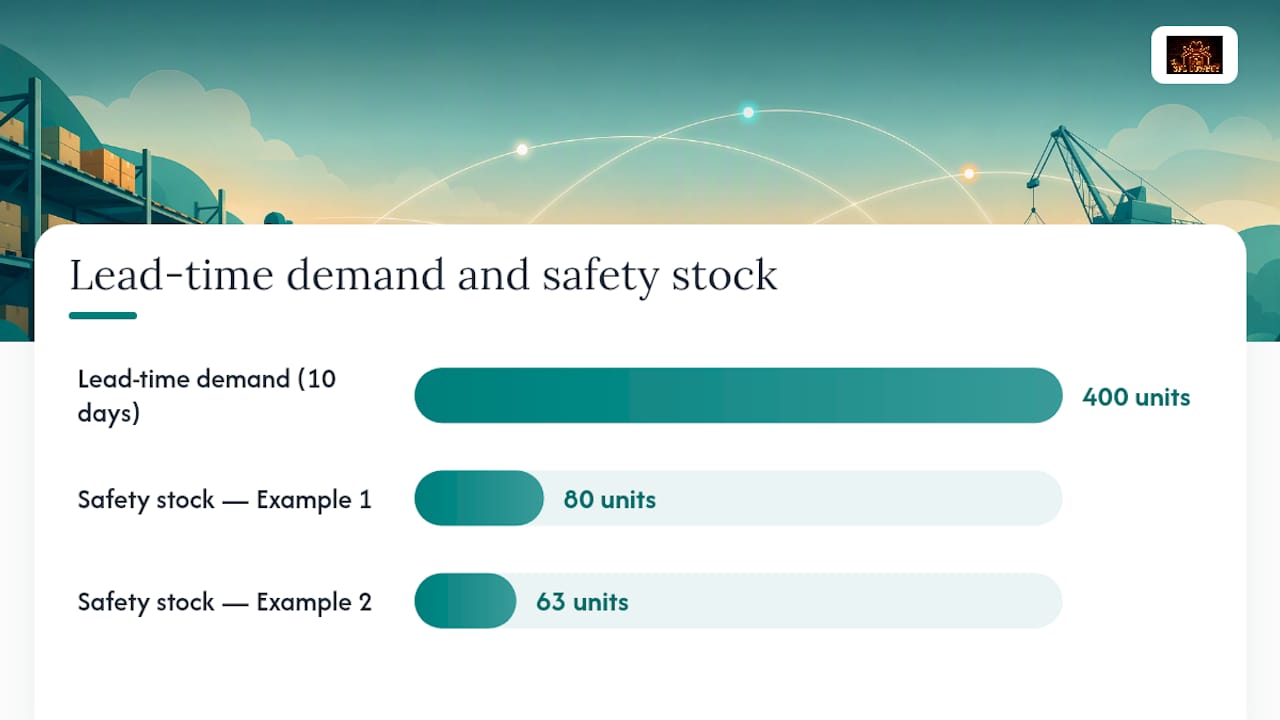
Example 1: Steady demand, fixed safety stock.
- A SKU sells 40 units per day on average, with a lead time of 10 days.
- Lead-time demand = 40 × 10 = 400 units.
- You carry a fixed safety stock of 80 units (roughly two days of cover).
- ROP = 400 + 80 = 480 units. Reorder the moment on-hand inventory hits 480.
Example 2: Variable demand, 95% service level.
- Same SKU, but demand actually ranges day to day, with a standard deviation (σd) of 12 units.
- Lead time stays at 10 days, and you’re targeting a 95% service level, so Z = 1.65.
- SS = 1.65 × 12 × √10 = 1.65 × 12 × 3.16 ≈ 63 units.
- ROP = (40 × 10) + 63 = 400 + 63 = 463 units.
Notice the probabilistic method here actually lands below the flat 80 unit buffer from Example 1, because the demand variability wasn’t as extreme as the arbitrary two day cushion assumed. That’s the real value of the calculation: it replaces a guess with a number tied to actual variance.
One more piece before this trigger goes live in your system: your on-hand count needs to include goods-in-transit (GIT) and quantity already on order. If you’re comparing raw warehouse stock against your ROP and ignoring the PO that’s three days from arriving, you’ll double-order every time. The trigger logic should compare ROP against on-hand plus on-order plus GIT, minus anything already committed to outbound orders.
Setting Up Reorder Points in Your ERP or WMS
Most ERP and WMS platforms give you dedicated fields for this, but they only work if someone populates them correctly and keeps them current. At minimum, you need: on-hand quantity, committed quantity, on-order quantity, goods-in-transit, a reorder point field, and a reorder quantity field, kept separate from the ROP so the “when” and “how much” logic don’t get tangled.
Automation rules decide what happens when a SKU crosses its ROP. Some systems auto-generate a purchase order the instant on-hand hits the trigger; others route it to a human for review. The right call depends on the SKU’s dollar value and your supplier relationship:
- Auto-create POs for low-dollar, high-velocity items with reliable suppliers, since the risk of an automated mistake is small.
- Require human review for high-dollar SKUs, new suppliers, or anything with a minimum order quantity that could tie up cash unnecessarily.
- Set a dollar threshold guardrail so any auto-generated PO above a set value routes to a buyer for sign-off before it fires.
- Respect supplier order windows, since triggering a PO the day after a supplier’s weekly cutoff just adds a week of dead time to your effective lead time.
Recalculation cadence should scale with SKU importance. A-items (your top revenue drivers) deserve continuous or weekly review, since a stale ROP there costs you the most. B and C items can run on a monthly or quarterly cycle without much risk, an approach that lines up with how 3plcowboy’s inventory optimization work segments recalculation effort by SKU class instead of treating every item the same.
Pro Tip: Before any cutover to a new WMS or ERP, audit your existing ROP fields for phantom inventory, on-hand numbers that look real but don’t match physical counts. A reorder point built on bad on-hand data will misfire no matter how good the formula is. The ERP-WMS integration pitfalls that create this problem are worth reviewing before go-live, not after.
How ROP and EOQ Work Together
ROP answers when to reorder. Economic order quantity, EOQ, answers how much to order once that trigger fires, balancing ordering costs against carrying costs to find the cheapest total order size. The two aren’t competing formulas, they’re paired decisions that should be set up together.
Common pairings look like this:
- ROP triggers a calculated EOQ, best when order costs and holding costs are both well understood and worth optimizing against each other.
- ROP triggers a fixed reorder quantity, simpler to manage, common for SKUs where order cost is negligible.
- ROP triggers a supplier-minimum lot multiple, forced by MOQs regardless of what EOQ math says is “optimal.”
The trade-off underneath all three: tightening your service level (a higher Z-score, more safety stock) raises carrying cost, while a leaner ROP saves on holding cost but raises stockout risk. Neither number exists in isolation from the other.
Common Reorder Point Mistakes and How to Fix Them
Watch for three warning signs: repeated stockouts on a SKU that “should” have plenty of buffer, days-of-supply that keeps drifting upward without explanation, and order surges that don’t match any real demand signal.
- Stale lead-time samples. If your ROP was set using data from 18 months ago and your supplier’s shipping performance has changed, the trigger is calculated against a lead time that no longer exists. Re-pull recent POs and recalculate.
- Ignored seasonality. A flat average daily demand figure crushed across a seasonal spike and a seasonal trough will underbuy in peak and overbuy in the lull. Segment demand by season, or run separate ROPs for peak periods.
- Bad demand segmentation. Grouping a fast-moving SKU with a slow-moving variant under one blended average produces a number that’s wrong for both. Split them.
- Phantom inventory. If your on-hand count in the system doesn’t match the physical shelf, count as it approaches ROP or use it as your cadence trigger.
Pro Tip: After any ROP fix, track fill rate, stockout incidents, and days-of-supply drift for at least one full replenishment cycle before declaring victory. One clean month doesn’t prove the fix held. Brightpearl’s guidance on recalculation cadence backs the same point: ROP only works when demand stays reasonably predictable and lead times stay stable, and both assumptions need periodic checking, not a one-time setup.
What Operator Experience Adds to the Formula
Michael Nooner built The 3PL Cowboy on 17-plus years running operations for brands including Nike, Walmart, DHL, FedEx, Kellogg’s, and Peloton, work that included taking a Nike inventory operation from 61% to 98%-plus cycle count accuracy across more than 450,000 SKUs and leading an eight-month WMS rollout across 60-plus Sysco sites. The pattern that shows up across those engagements: ROP failures are rarely a math problem. They’re a data-discipline problem, stale lead times, blended SKU classes, phantom on-hand counts feeding a formula that was never wrong in the first place. The rule of thumb from those rollouts holds regardless of system: sample lead time from at least ten recent orders per SKU, and recalculate A-items on a cadence measured in weeks, not quarters.
— Michael
When to Use ROP Versus Other Replenishment Approaches
ROP fits best for repetitive SKUs with stable lead times, retail replenishment, standard components. For project-based work, custom builds, or perishables with hard expiration windows, MRP, kanban, or manual planning usually fits better. Most mixed catalogs need a hybrid: ROP for the steady majority, exception-based planning for the rest.
How 3plcowboy Helps Fix Reorder Point Problems Before They Cost You
Bad ROP math rarely stays a math problem for long. It turns into rush freight, blown fill rates, or a warehouse full of dead stock, and by the time that’s visible on a P&L, the fix costs more than the diagnosis would have. 3plcowboy is built for exactly that gap: an independent advisory with no warehouse to fill and no 3PL listings to push, running underwriting-grade diligence on decisions most teams make off a sales call.

If your reorder points are misfiring because your WMS setup, lead-time data, or 3PL relationship isn’t giving you numbers you can trust, that’s a systems and governance problem before it’s a formula problem. 3plcowboy’s Inventory Optimization work and broader 3PL Selection & Diligence engagements exist to fix exactly that, whether the issue is a stale ROP process, a WMS rollout that needs an operator’s eye, or a 3PL relationship that’s feeding you unreliable lead-time data in the first place. Browse the full service lineup and get a straight assessment of where your replenishment governance is actually breaking.
Where to Verify the Formulas Yourself
A few sources worth bookmarking alongside your spreadsheet: NetSuite’s ROP breakdown for the standard formula, SupplyChainMath’s guide for the probabilistic Z-score version, and the NC State SCM tutorial for deeper stochastic derivations. An Omni Calculator ROP tool is a fast way to sanity-check your own numbers before committing them to a live system.
Sources
- Reorder Point Formula: Guide with Worked Examples | SupplyChainMath
- Reorder point formula & safety stock | inFlow Inventory
- Reorder point formula: inventory management models — tutorial | NC State SCM
FAQ
What Is a Good Inventory Reorder Point?
A good reorder point covers your average demand during lead time plus enough safety stock to protect your target service level, nothing more. There’s no universal number, since it depends entirely on your SKU’s demand volatility, lead time, and how much stockout risk you’re willing to carry.
What Do EOQ and ROP Mean?
ROP is the trigger, the stock level that tells you when to place an order. EOQ, economic order quantity, is the order size, the amount that minimizes total ordering and carrying cost once that trigger fires.
What Is a Reorder Point?
A reorder point is the inventory level at which you place a new purchase order to avoid running out before replenishment arrives. The standard formula is ROP = (Average daily demand × Lead time) + Safety stock.
How Do You Calculate the Reorder Level of Inventory?
Multiply your average daily demand by your lead time in days, then add safety stock, calculated either as a fixed buffer, the max-avg method, or a probabilistic Z-score formula for volatile SKUs. Always base lead time on actual PO-to-putaway history, not a supplier’s quoted estimate.
How Often Should You Recalculate a Reorder Point?
High-velocity A-items deserve continuous or weekly recalculation, since stale data there does the most damage. Slower B and C items can run on a monthly or quarterly cycle without meaningful risk.