Network design modeling is the structured use of demand, capacity, and transport data to prescribe where to place and how to size distribution nodes and transport flows against a defined business objective. Companies run it when growth, a channel shift, rising cost to serve, or a resilience gap forces a hard look at the footprint. A sound project produces a ranked site shortlist, capacity sizing by node, a transport lane plan, and an estimated P&L impact leadership can act on.
TL;DR:
- Get operations and finance to approve the baseline before scenarios; unvalidated lane costs or facility capacities can invalidate otherwise sound optimization results.
- Use demand by geography and product group, a full seasonal cycle of historical flows, lane rates, facility capacity, handling times, and lead times.
- For large networks, aggregate demand and group products to keep mixed integer models solvable; use stochastic scenarios when uncertainty or revenue tradeoffs drive decisions.
- Test recommendations against demand shifts, fuel costs, transport modes, and lead time changes, then tie each shortlisted site to capital, operating costs, and implementation milestones.
- Track cost per order, service coverage, and facility utilization after launch; frequent channel or capacity changes favor an updated reusable model over repeat studies.
Table of Contents
- When Network Design Modeling Is the Right Tool for the Job
- Practical Project Framework: Phases, Deliverables, and Sign-Off Milestones
- Data and Baselining: Inputs, Common Gaps, and Pragmatic Fixes
- Modeling Approaches: MILP, Stochastic Methods, Heuristics, and Digital Twins
- Turning Outputs Into Decisions: Interpretation and Sensitivity Checks
- Operator Perspective: Shortcuts, Red Flags, and What to Fix First
- Timeline and Cost Considerations for a Network Design Project
- Common Software Tools and Platforms Used in Network Design Modeling
- Integrating Network Design Modeling With Your ERP and WMS
- Post-Implementation Monitoring and Continuous Improvement
- Stakeholder Roles and Cross-Functional Collaboration
- What Most Network Design Advice Gets Backwards
- How We Help You Execute Network Design Modeling
- FAQ
- Sources
When Network Design Modeling Is the Right Tool for the Job
Not every operational headache needs a full network study. Modeling earns its cost when the decision is structural: where to put nodes, how many you need, and how freight should flow between them. A pricing tweak or a single-lane carrier swap doesn’t need this level of machinery.
Objectives that typically justify a project include:
- Cost reduction: shrinking total landed cost across transportation, warehousing, and inventory carrying cost.
- Service improvement: cutting transit times or expanding same-day and next-day coverage into new zones.
- Resilience: reducing single-node exposure after a disruption, labor event, or lease expiration.
- Revenue-based redesign: reconfiguring the network to support new value-added services or channels rather than purely minimizing cost.
Common triggers are SKU growth that outpaces current capacity, a new sales channel that changes shipment profiles, a lease coming up for renewal, or a cost-per-order trend that’s been climbing for several quarters. A well-run project should leave you with a defensible shortlist of markets or sites, a capacity plan by node, and transport lane reassignments with a modeled cost delta, not a slide deck of theoretical scenarios nobody signs off on.
Practical Project Framework: Phases, Deliverables, and Sign-Off Milestones
Industry-standard network design work follows a consistent sequence: initiate and scope, build the baseline, define scenarios, model and simulate, then recommend and build the roadmap, with stakeholder sign-off built into the process before optimization work begins. Skipping a phase is the most common reason a project produces a report nobody acts on.
- Initiate and scope. Lock the business objective, identify the stakeholders who must approve the outcome, set a timeline, and define success metrics up front.
- Baseline. Collect, clean, and validate as-is data on demand, flows, costs, and capacity, then get operations and finance to sign off on the baseline before any modeling starts.
- Scenarios. Define the what-ifs explicitly tied to the business objective, whether that’s cost, resilience, or revenue, so the model answers a question someone actually asked.
- Model and simulate. Run constrained and unconstrained optimization passes, then stress-test results with sensitivity analysis.
- Recommend and roadmap. Produce a ranked shortlist, capex and OPEX estimates, a phased execution plan, and the KPIs that will govern go or no-go decisions.
Pro Tip: Get written sign-off on the baseline before you touch a scenario. A model built on an unvalidated baseline wastes every hour spent on the optimization that follows.
Each phase produces a deliverable that the next phase depends on. Treating the baseline as a formality rather than a milestone is where most projects quietly lose credibility with the executives who eventually have to approve capital.
Data and Baselining: Inputs, Common Gaps, and Pragmatic Fixes
A model is only as good as the baseline underneath it, and a reusable modeling capability only ever mirrors the quality of the data it’s built on, a point practitioner baselining research makes directly. Before anyone opens an optimization tool, you need a clean picture of what’s actually moving through your network today.
The essential inputs are:
- Demand by geography and SKU group, not just total volume, so the model can see where orders originate.
- Historical flows between existing nodes and customers over at least one full seasonal cycle.
- Carrier lane rates for every major origin-destination pair, including fuel surcharges.
- Facility capacities, handling times, and inventory rules at each existing node.
- Lead times by lane and by fulfillment method.
One of the most common model failures traces back to missing or wrong inputs: incomplete cost lanes, SKU anomalies, and inaccurate facility capacity figures routinely invalidate otherwise sound optimization runs, according to baselining research from LEK.
Practical fixes include aggregating demand to the city or ZIP3 level instead of chasing SKU-level granularity you can’t solve against, grouping SKUs into a manageable number of flow categories, and imputing missing lane rates with regression or nearest-neighbor methods rather than leaving gaps, aided by insights on why distribution center redesigns become necessary. Walk the flows with operations leads to confirm handling times on the floor, reconcile capacity against physical measurements, and get a documented sign-off before you move to scenario design. Our supply chain assessment framework follows this same baselining discipline before any larger network project begins.
Modeling Approaches: MILP, Stochastic Methods, Heuristics, and Digital Twins
The right modeling approach depends on network size, timeline, and how much uncertainty the objective needs to account for.
- MILP and MIP formulations deliver explainable, mathematically optimal solutions, but they hit scaling limits fast on large, real-world networks. Case studies using large-scale integer programming show that practical projects need size-reduction techniques, such as demand aggregation and SKU grouping, to keep solve times reasonable. One effective tactic: if stores are typically served by a single distribution center, dropping the SKU dimension from outbound flow variables cuts the problem size dramatically without sacrificing the decisions that matter.
- Stochastic and scenario-based optimization captures demand uncertainty and revenue-driven trade-offs that a deterministic model misses, which matters most for resilience and revenue-based objectives.
- Heuristics and decomposition break a problem that won’t solve exactly into solvable pieces, trading a small amount of optimality for a model that actually finishes running.
- Digital twins and reusable models extend the investment beyond a one-time answer. MIT research on facility location optimization recommends a two-stage approach of GIS-based candidate screening followed by optimization, and notes that building a reusable capability gives a company ongoing scenario-testing ability instead of a single static answer.
Picking size-reduction over a theoretically perfect store-level model is usually the more useful call. A model that solves and gets used beats an elegant one that times out.
Turning Outputs Into Decisions: Interpretation and Sensitivity Checks
A model is only valuable once its output becomes a decision leadership will fund. That means translating optimization results into metrics finance and operations already track.
Present results in terms of:
- Marginal transport cost per lane, so transportation leaders can see exactly what changes.
- Facility utilization at each existing and proposed node.
- Service coverage, meaning the share of demand served within target transit time.
- Incremental capex and OPEX tied to each recommended change.
- Expected P&L impact over a defined horizon.
Before recommending anything, run sensitivity tests against demand shifts, fuel or cost escalation, alternative transport modes, and changes in facility lead times. A recommendation that only holds under one narrow assumption set isn’t ready for a capital committee.
| Deliverable | What it tells leadership |
|---|---|
| Prioritized site shortlist | Which markets or facilities to pursue first, ranked by modeled impact |
| Phased capacity additions | When and where to add capacity as volume grows |
| Transport lane reassignments | Which lanes change carrier, mode, or routing and why |
| ROI and implementation milestones | The payback timeline tied to each recommended change |
Scenario testing across best, average, and worst-case assumptions is what separates a defensible recommendation from a single point estimate that collapses the moment demand misses the forecast.
Operator Perspective: Shortcuts, Red Flags, and What to Fix First
Baseline validation isn’t a checkbox, it’s the step that determines whether leadership trusts the rest of the project.
Quick wins: group SKUs into flow categories before you model, impute missing lane costs rather than leaving gaps, and prioritize high-volume ZIP codes when screening candidate sites instead of treating every market equally.
Pro Tip: If operations can’t confirm a capacity or handling-time figure on the floor within a day, treat it as unvalidated and flag it before the model runs, not after.
Governance matters as much as math: recommendations only convert into capital when finance and operations co-sign the baseline and the scenario definitions before the modeling starts.
— Michael
Timeline and Cost Considerations for a Network Design Project
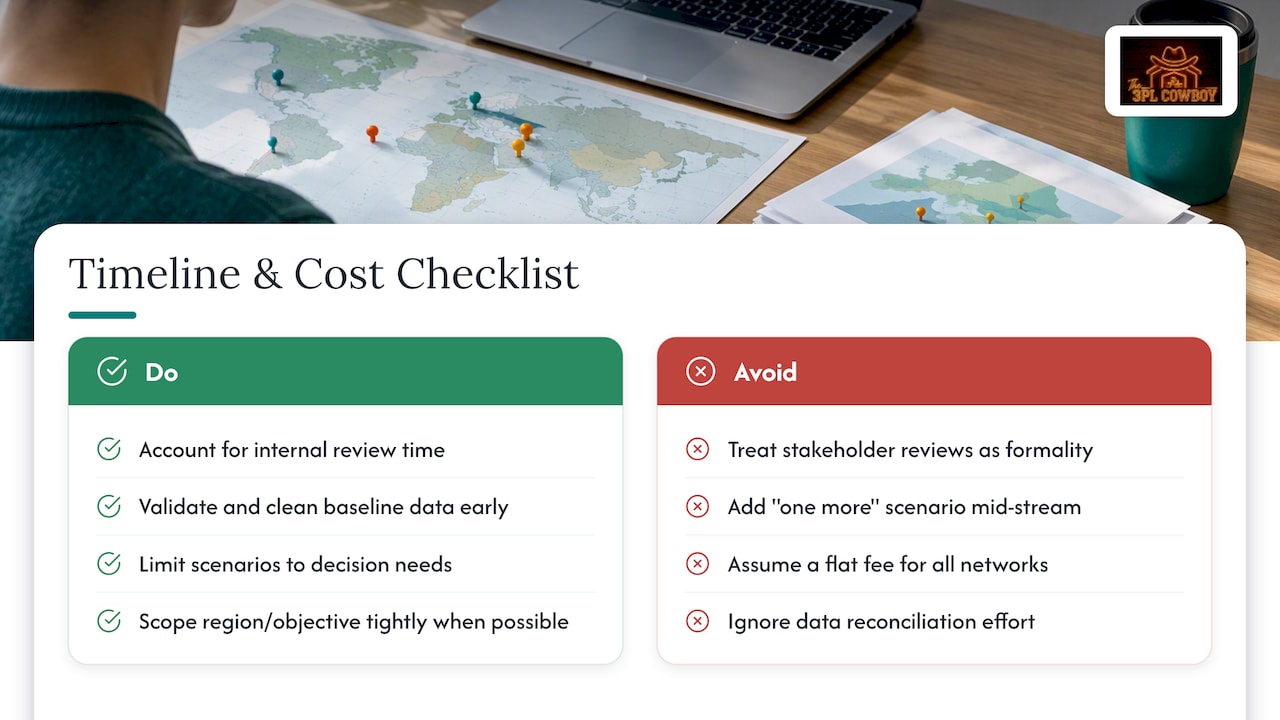
A focused network design project typically runs several months from scoping through final recommendation, with the baseline and scenario phases usually consuming the largest share of that time. Projects scoped around a single region or a narrower objective, such as resilience for one product line, tend to move faster than full-network redesigns covering every facility and channel.
Cost drives mainly off three factors: the number of facilities and lanes in scope, how much of the baseline data already exists in usable form, and how many scenarios leadership wants tested before signing off. A company with clean ERP and transportation management data moves through baselining faster than one reconciling spreadsheets from three different systems. Scope creep, usually from adding “just one more scenario,” is the most common reason a project’s timeline slips.
Budgeting realistically means accounting for internal time, not just external fees: operations and finance staff need to validate data, confirm capacity figures, and sign off at each milestone. Treating those reviews as a formality rather than real work is a common way projects stall between the modeling phase and the implementation roadmap. For fee-based engagements, Distribution Network Design advisory pricing is typically scoped to the specific network and objective rather than quoted as a flat rate, since a single-DC capacity study and a multi-region redesign carry very different levels of effort.
Common Software Tools and Platforms Used in Network Design Modeling
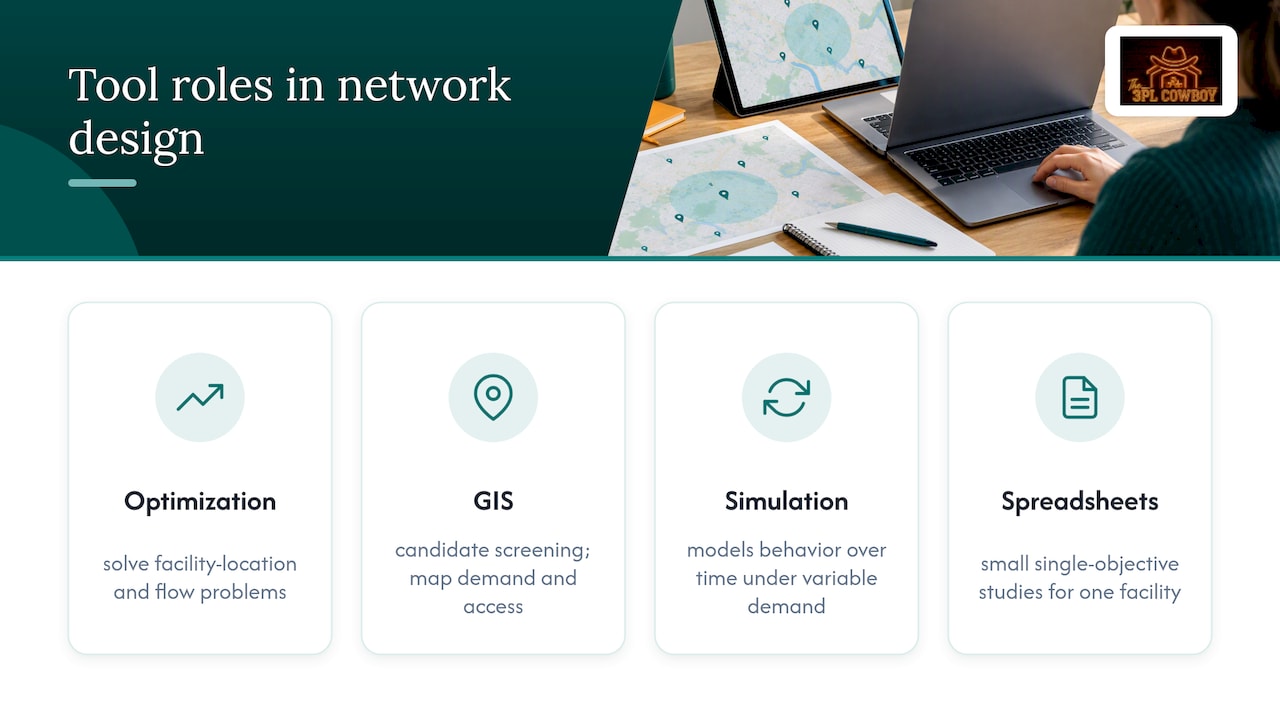
Most network design work runs on one of a few categories of tools rather than a single standard platform. Optimization engines built for MILP and MIP solving handle the mathematical core of facility-location and flow problems. GIS platforms handle the candidate-screening stage, mapping demand density and transport access before optimization narrows the field, an approach MIT research recommends for large retail networks as a practical way to shrink the search space before running a full optimization pass.
Simulation software adds a layer the optimization engines don’t cover well: it models how a proposed network behaves over time under variable demand, rather than producing a single static answer. That distinction matters for stress-testing a recommendation before it goes to a capital committee.
Spreadsheet-based modeling still has a place for smaller, single-objective studies, such as evaluating one additional facility, where the overhead of a full optimization platform isn’t justified. The tool matters less than whether the team running it understands the baseline data well enough to trust what the software returns. A sophisticated platform fed bad lane-cost data produces a confident, wrong answer just as easily as a spreadsheet does.
Integrating Network Design Modeling With Your ERP and WMS
A network design model doesn’t operate in isolation. Its most valuable inputs, demand history, order profiles, SKU attributes, and historical flows, typically live in the ERP and WMS systems already running your operation. Pulling clean extracts from those systems is usually faster and more reliable than rebuilding the same data from scratch in spreadsheets.
The integration challenge usually isn’t technical access, it’s data consistency. ERP systems often categorize SKUs differently than the WMS tracks them on the floor, and reconciling those two views is part of the baselining work covered earlier. Transportation management systems add another layer, since actual lane rates and transit times often diverge from the rate cards used in planning.
Once a recommendation is approved, the relationship flips: the network model’s outputs, new facility assignments, updated lane routings, revised capacity allocations, need to flow back into the ERP and WMS so day-to-day operations actually reflect the new design. A network study that produces a report but never gets encoded into the systems running daily orders has, in practice, changed nothing. Firms running regular benchmarking, like our fulfillment cost analysis work, typically pull directly from these same ERP and WMS extracts to keep cost-to-serve figures current between full network studies.
Post-Implementation Monitoring and Continuous Improvement
Approving a network design recommendation is the start of the work, not the end of it. Facility utilization, lane costs, and service coverage all need tracking against the modeled projections for at least the first several quarters after go-live, since real-world demand rarely matches the baseline assumptions exactly.
Set a short list of KPIs tied directly to the objective the project was built around: cost per order against the modeled target, on-time service coverage by zone, and facility utilization against planned capacity. When actuals drift meaningfully from the model’s projections, that’s the signal to revisit assumptions rather than wait for the next full network study.
This is where the case for a reusable modeling capability gets stronger. A one-off model answers the question it was built for, but MIT’s research on facility location points out that a digital twin kept updated with new assumptions gives a company ongoing scenario-testing ability rather than a single static answer that ages out within a year or two. For networks facing frequent structural change, new channels, fast SKU turnover, or regular capacity additions, that ongoing capability tends to pay for itself faster than commissioning a fresh study each time conditions shift.
Stakeholder Roles and Cross-Functional Collaboration
Network design decisions touch too many functions to run as an analytics-only exercise. Operations leads validate capacity and handling-time assumptions on the floor. Finance owns the capex and OPEX figures that turn a modeled recommendation into a budget line. Transportation and procurement teams confirm lane rates and carrier capacity. Sales and customer service weigh in on service-level trade-offs that affect revenue, particularly in a revenue-based redesign.
Clear ownership at each phase keeps the project moving. The sponsor who owns the business objective should sign off on scope before baselining starts, operations and finance should jointly validate the baseline, and the executive group with capital authority should review the final shortlist and roadmap before anything moves to execution. Capability frameworks from Deloitte and ASCM describe supply network design as a capability that depends on synchronized planning and scenario testing across functions, not a standalone analytics deliverable.
Skipping cross-functional review at any phase is a common reason recommendations stall after the model is done. A shortlist that finance hasn’t priced or operations hasn’t validated rarely survives contact with a capital committee, no matter how rigorous the underlying math.
What Most Network Design Advice Gets Backwards
Most of what gets published on this topic treats the optimization engine as the hard part and the baseline as a formality. In practice, the math is the easy half. Any reasonably competent MILP solver will find an optimal answer to whatever problem you hand it. The real risk is handing it the wrong problem: bad lane costs, SKU categories that don’t match how the business actually groups products, or capacity figures from a spreadsheet nobody has checked against the floor in two years.
The conventional advice also tends to treat a network study as a one-time event. For a business with a stable footprint, that’s fine. For one adding channels, SKUs, or facilities every year, a static model goes stale fast, which is exactly why a reusable, updatable capability tends to outperform a single polished report over a multi-year horizon.
If you take one thing from this: spend disproportionate time on baselining and sign-off before you touch a scenario. The shortlist and roadmap only matter if the numbers underneath them hold up when finance and operations both look closely.
— Michael
How We Help You Execute Network Design Modeling
Running a network design project internally takes bandwidth most ops and finance teams don’t have sitting idle, and a rushed baseline produces a shortlist nobody trusts. We built our Distribution Network Design advisory around the same operator-grade sequence covered above: baseline validation first, scenario modeling tied to your actual business objective, and a shortlist your executive team can act on without re-litigating the math.

A typical engagement with us includes:
- A baseline audit of your current demand, flows, capacity, and lane costs, validated with your operations team.
- Scenario modeling built around the specific objective driving the project, whether that’s cost, resilience, or a new channel.
- A ranked site and capacity shortlist with a phased implementation roadmap and the KPIs to govern go or no-go decisions.
We also run Fulfillment Cost Benchmarking and 3PL Selection & Diligence for teams whose network decisions involve evaluating outsourced partners alongside facility changes. Reach out through our services page to scope your project.
FAQ
What is network design modeling in supply chain?
Network design modeling is the use of demand, cost, and capacity data to decide where distribution facilities should be located, how big they should be, and how transport flows should run between them. The output is a set of implementable decisions, not a theoretical exercise, typically including a site shortlist, capacity plan, and transport lane changes.
How long does a network design project usually take?
Most focused projects run several months from initial scoping through a final recommendation, with the baseline and scenario phases typically taking the longest. Scope, data readiness, and the number of scenarios tested all affect the timeline.
What data do I need before starting a network design study?
You need demand by geography and SKU group, historical flows, carrier lane rates, facility capacities and handling times, and lead times by lane. Baselining research consistently finds that missing lane costs and inaccurate capacity figures are the most common reasons a model’s output ends up unreliable.
Should I build a reusable model or a one-time study?
A one-time study works for a stable network with no major structural changes expected. MIT research on facility location optimization suggests a reusable, digital-twin-style capability is worth the investment when a business expects frequent changes like new channels or fast SKU turnover.
What does a distribution network design engagement typically cost?
Pricing for a network design advisory engagement is scoped to the size of the network and the objective, since a single-facility capacity study costs far less effort than a multi-region redesign. Our Distribution Network Design service quotes engagements based on that scope rather than a flat rate.
Sources
- 4 Pillars of Supply Chain Network Design: Part 1 — Initiate, Plan
- Right time, right place: facility location optimization
- Large-scale integer programming model and model decomposition framework (INFORMS case study)
- LEK: Optimizing distribution footprint — practical baselining advice