Design cross-dock facilities around freight flow and door-resource coupling: pick door counts and staging geometry to match your daily waves, then validate with simulation. A working design delivers matched door capacity, right-sized staging lanes, a forklift plan that clears trucks without queuing, and a WMS with appointment controls tight enough to keep dwell time low.
TL;DR:
- Use a representative week’s appointment schedule to map origin and destination flows, then design doors, staging, and routing together; one case cut travel about 16%.
- Keep strip assignments for stable lanes and pool flexible doors when flows swing; test peak, disruption, and mix shifts before fixing capacity.
- Size staging from peak simultaneous volume, not daily totals, and check row lengths against aisle access and forklift turning room; set hard lane limits.
- Match forklift staffing to simultaneous active doors, then identify when extra equipment stops reducing queues; hourly idle time can reveal scheduling problems.
- Require the WMS to use advance shipment notices for lane assignments, verify freight at both doors, flag exceptions live, and share dock status with carriers.
Table of Contents
- What Cross-Dock Facility Design Actually Means
- Mapping Inbound to Outbound Paths Before You Draw a Floor Plan
- Dock Door Planning: Counts, Capacities, and the Strip, Stack, or Mixed Decision
- Staging Lanes: Sizing Rows, Lengths, and Assignment Rules
- Matching Forklifts and Operators to Door Count
- Technology and Controls: What the WMS Has to Do
- Design Workflow: From Forecast to Stress-Tested Floor Plan
- Safety and Compliance Considerations in Cross Dock Design
- Environmental and Sustainability Aspects of Cross-Dock Layouts
- Integrating Cross-Dock Design with Transportation Modes and Yard Management
- Choosing and Placing Loading and Unloading Equipment
- Designing Staging and Doors with Room to Scale
- Ergonomics and Layout: Where Facility Design Meets Labor Efficiency
- Operator Perspective: Pragmatic Tradeoffs and Common Pitfalls
- How We Help You Get Cross-Dock Design Right the First Time
- FAQ
- Sources
What Cross-Dock Facility Design Actually Means
Cross docking moves freight from inbound trailers to outbound trailers with little or no time in storage. In single-touch cross docking, product moves straight from an inbound door to an outbound trailer. In two-touch cross docking, product lands briefly in a staging lane, gets sorted or consolidated, and then loads out. The distinction matters because two-touch operations need more staging capacity and tighter lane assignment rules, while single-touch operations live or die on door-to-door scheduling.
Cross docking tends to beat conventional warehousing when freight is already sorted by destination, when LTL consolidation into full truckloads cuts linehaul cost, when peak-season volume needs a pass-through lane instead of storage, or when perishable product cannot sit on a shelf. The Produce Traceability Initiative’s cross-docking guide treats this kind of load-only movement as a distinct operating mode that requires its own traceability controls, not a scaled-down version of a storage warehouse.
Facility shape drives how freight can flow once it is inside the building. The common shapes each carry layout tradeoffs:
- I-shape (straight-through): inbound doors on one side, outbound on the opposite side, freight travels a straight line, simplest to operate but limited in total door count for a given building width.
- L-shape: doors on two adjacent sides, useful when the site forces an irregular footprint, but it creates a corner congestion point that needs wider aisles.
- T-shape: a central staging spine with doors on three sides, common in high-volume hubs that need to separate multiple carrier types.
- Rectangular (perimeter) shape: doors around most of the building perimeter with staging in the core, the highest door density per square foot but the most complex internal travel pattern.
Smaller operations usually do best with an I-shape or L-shape because travel distances stay short and the door-assignment logic stays simple. Larger hubs tend toward T-shape or rectangular layouts to fit more doors, accepting more complex internal routing in exchange for throughput.
Mapping Inbound to Outbound Paths Before You Draw a Floor Plan
Before placing a single door, build an origin-to-destination flow matrix: every inbound source paired with every outbound destination, weighted by expected pallet or case volume per wave. That matrix is the actual design input, not the building footprint. Research on layout and control policies for cross-dock operations found that jointly selecting routing, storage assignment, and staging geometry, rather than choosing each in isolation, reduced employee travel distance by about 16% in a cited case application. Treat door placement, staging geometry, and internal routing as one decision, not three sequential ones.
Once the flow matrix exists, three layout rules consistently reduce travel and congestion:
- Place the highest-volume origin-destination pairs on the shortest physical path. The flows that move the most pallets per wave should never share an aisle with slow-moving or exception freight.
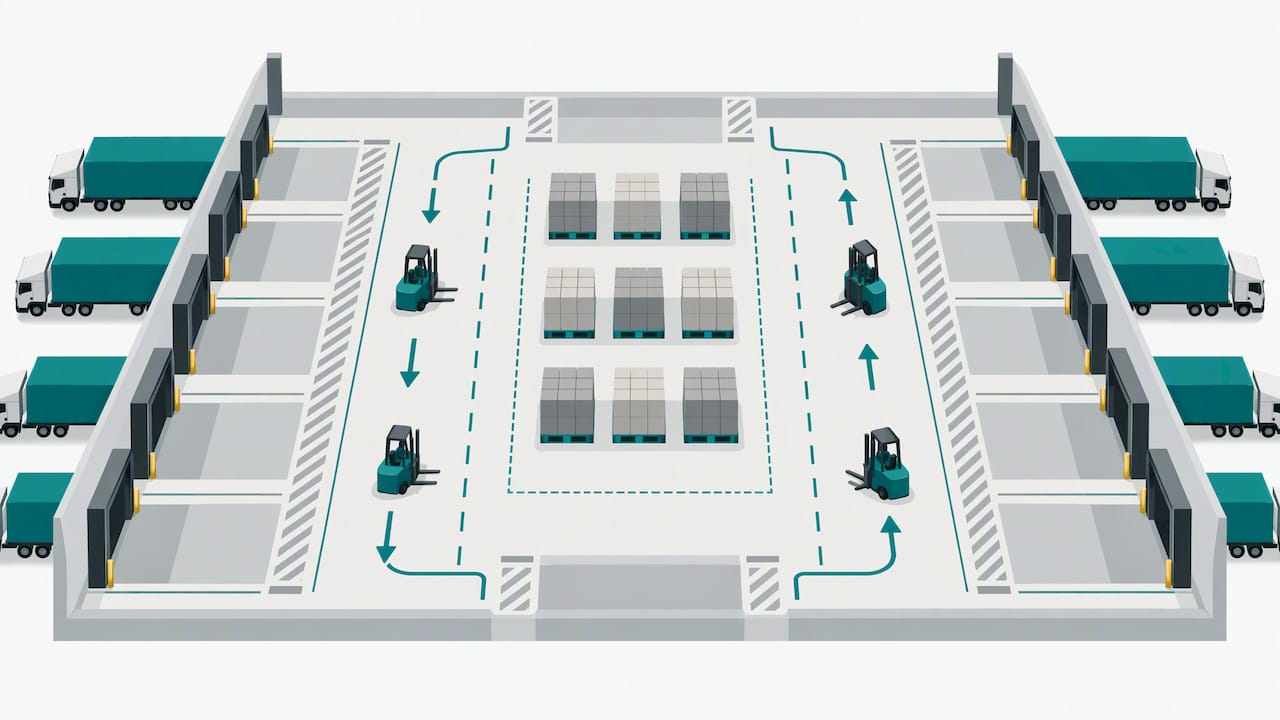
- Separate inbound and outbound travel lanes wherever the building width allows it. Crossing traffic at the staging line is where most dock-area collisions and delays happen.
- Buffer high-turnover lanes with dedicated short-dwell staging, not shared floor space. A lane that turns four times a shift needs its own marked footprint so it never competes with slower freight for the same square footage.
A small regional cross dock handling two or three carrier relationships can often run on a single flow matrix with strip-door assignment: each door dedicated to one lane or route family, simple to schedule, simple to train staff on. A large multi-carrier hub moving dozens of destination lanes usually needs a mixed-door strategy, where some doors flex between inbound and outbound roles depending on the wave, because no fixed assignment can keep up with the variability in a 24-hour schedule.
Pro Tip: Build your flow matrix from the actual appointment schedule for a representative week, not from annual averages. Wave-level data exposes the congestion points that a daily or weekly average hides.
The practical difference between a strip-door and stack-door approach comes down to how much the daily mix shifts. Strip-door assignment, one door per route or carrier, works when the lane mix is stable and the biggest risk is a single door going down. Stack-door assignment, multiple compatible lanes sharing a pool of doors, works when volume by lane swings hard day to day and a fixed assignment would leave some doors idle while others back up. Most mid-size operations end up on a mixed model: a core of strip-assigned doors for the highest, most predictable volume lanes, and a flexible pool for everything else. If your facility sits inside a broader network decision, this is also the point to loop in distribution network design work, since door strategy at one node changes the routing math at every other node in the network.
Dock Door Planning: Counts, Capacities, and the Strip, Stack, or Mixed Decision
Door count and nominal capacity should be decided before you know exactly how a given day’s scenario will play out, not after. A methodology for the cross-dock door design problem under uncertainty frames this as a two-stage decision: fix the number and capacity of inbound and outbound doors in a strategic first stage, then assign specific origin and destination flows to those doors once demand for a given day or scenario is known. Sizing doors to an average day instead of modeling the range of scenarios tends to produce higher assignment costs when real variability hits, since the fixed infrastructure can’t flex to the day you actually got.
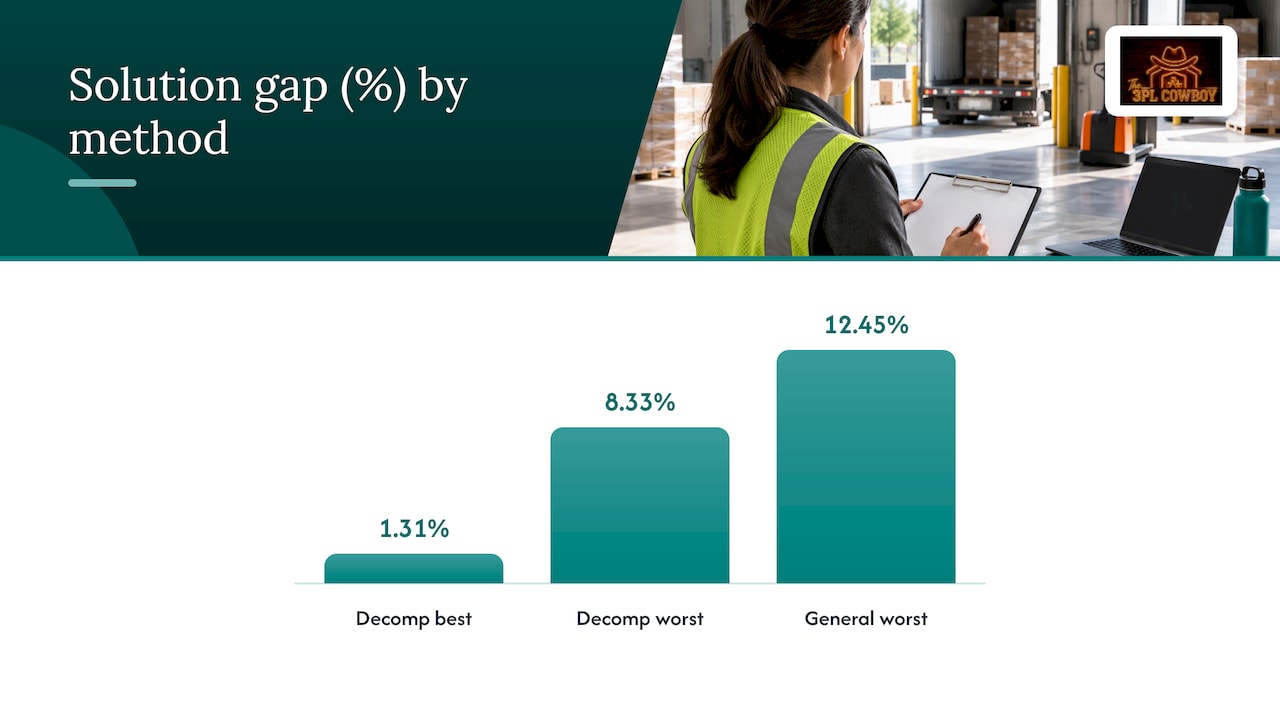
That same research reports that a decomposition-based solution method it tested reached solution gaps of 1.31% to 8.33% versus up to 12.45% for a general-purpose solver on the test instances used, a result from a computational study rather than a guarantee for any specific facility.
Practical door-count decisions should account for:
- Peak wave volume, not average daily volume, since door congestion happens at the peak hour, not the daily mean.
- The split between dedicated and flexible doors, balancing scheduling simplicity against resilience to demand swings.
- Door downtime risk, building in enough flexible capacity that one blocked or disrupted door does not cascade into missed outbound departures.
- Future volume growth, since adding doors later usually means a facility expansion, not a quick retrofit.
Mixed-door strategies earn their complexity when the business has enough day-to-day variability that a fixed assignment would leave capacity stranded on light days and overloaded on heavy ones. The tradeoff is real: a strip-door model is easier to schedule and easier to train staff against, but it is brittle. A mixed-door model absorbs volatility better but demands a WMS and a scheduling team capable of reassigning doors by wave, not by habit. For operations running close to capacity with high day-to-day swings, it is worth building in an explicit overflow plan, whether that is overflow lanes inside the facility or a formal peak and overflow capacity arrangement, rather than discovering the gap during a peak week.
Staging Lanes: Sizing Rows, Lengths, and Assignment Rules
Staging space is operational capacity, not dead space, and it should be sized with the same rigor as door count. A staging manual for high-volume distribution centers frames temporary staging as working floor space that needs deliberate row count, row length, and assignment-frequency decisions, with the layout built to allow controlled reconfiguration rather than a fixed, permanent footprint.
The practical conversion from required capacity to physical rows follows a simple sequence:
- Start from peak simultaneous staged volume, the highest number of pallets or cases that will sit in staging at once during a wave, not the daily total.
- Divide that peak volume by your standard pallet or case footprint per linear foot to get total linear footage of staging needed.
- Split that linear footage across a number of rows that matches your aisle-access needs, since fewer, longer rows reduce aisle count but increase travel distance to the far end of a row.
- Check the result against forklift turning radius and aisle width, since a row length that looks efficient on paper can still create a bottleneck if trucks can’t maneuver at the row ends.
A dedicated storage-assignment method for row-based cross-dock staging has shown meaningful travel-distance improvements over common heuristics in research on positioning goods in a cross-docking environment, using it to convert capacity and door counts into specific row counts and lengths rather than relying on rule-of-thumb spacing.
Assignment rules matter as much as the physical geometry. Block assignment, grouping freight for the same destination into one lane, keeps loading simple but wastes space when a lane is partially full. First-out prioritization, placing freight expected to load soonest closest to the outbound door, cuts travel at the cost of slightly more complex lane management. Hard capacity limits per lane prevent the common failure mode of freight overflowing into aisle space because nobody flagged the lane as full.
Reconfiguration frequency should follow the business cycle, not a fixed calendar. The Vis and Roodbergen research on cross-dock layout and control policies makes the case that the ideal staging arrangement depends on current activity patterns, so the floor plan should support routine reconfiguration rather than a layout frozen at launch.
Matching Forklifts and Operators to Door Count
Forklift count needs to be sized against the number of doors active at once and the number of simultaneous truck operations expected during a peak wave, not against total daily throughput. Modeling of multi-door cross-dock scheduling under flexible doors and material-handling restrictions treats door scheduling and forklift scheduling as a single coupled problem, because finite material-handling capacity is what actually produces the queues operators see on the floor, not door count alone.
That same body of work identifies clear transition points: specific forklift counts below which delays grow sharply and above which additional forklifts stop improving throughput. Below the transition point, every additional forklift resolves real bottlenecks. Above it, extra equipment sits idle while labor cost keeps climbing. Finding that number for your own wave pattern, rather than assuming more equipment always helps, is the single highest-leverage internal resource decision in cross-dock operations.
Practical planning points:
- Size forklifts to peak simultaneous door activity, since a facility with 20 doors rarely needs 20 forklifts running at once if waves are staggered.
- Overlap shifts around wave transitions, so the crew handling a heavy outbound wave does not hand off mid-surge to an undersized incoming shift.
- Separate staging tasks from loading tasks in scheduling, since combining them on the same operator roster tends to starve whichever task is less visible on a given hour.
- Track dock utilization and average forklift travel distance as live KPIs, not just end-of-day throughput, since those two numbers expose a bottleneck days before a missed departure does.
Pro Tip: Run a one-week test where you log forklift idle time by hour, not just by shift. A single hour of concentrated idle time next to a single hour of overload is usually a scheduling fix, not an equipment fix.
Technology and Controls: What the WMS Has to Do
A WMS running a cross-dock has to do more than track inventory because there is often no real inventory position to track, just freight in transit through the building. The Produce Traceability Initiative’s best-practice guide treats WMS capability and traceability procedure as operating prerequisites, not optional add-ons, especially for perishable flows that depend on advance shipment notices and case-level tracking.
At minimum, the system needs to:
- Accept advance shipment notices (ASNs) via EDI or API so staging lane assignments can be made before the trailer arrives, not after.
- Direct freight to a specific staging lane or straight to an outbound door based on the flow matrix, not a generic put-away rule.
- Support barcode or RFID verification at both inbound and outbound doors to catch misrouted freight before it leaves the building.
- Expose exceptions in real time, including short, over, or damaged freight, rather than surfacing them only in an end-of-day report.
- Maintain appointment scheduling and real-time dock status visible to carriers, so trucks arrive against the wave plan instead of clustering at the gate.
Temperature-controlled and produce flows need an extra layer of manual verification on top of the system controls, matching physical checks against the ASN and flagging any discrepancy before the load moves, since a system record is only as good as the data entered against it.
Design Workflow: From Forecast to Stress-Tested Floor Plan
A cross-dock design is not finished until it has been tested against more than the average day. The practical sequence runs:
- Forecast inbound and outbound wave volumes by hour, not just by day, since wave shape drives every downstream decision.
- Classify flows by origin-destination pair, turnover rate, and special handling needs such as temperature control.
- Choose a strip, stack, or mixed-door strategy based on how much the lane mix shifts day to day.
- Size staging lanes and door counts together, since the two decisions are coupled, not sequential.
- Assign internal resources, forklifts and labor, against the transition-point logic rather than a flat ratio to door count.
- Simulate peak, disruption, and mix-shift scenarios before approving the floor plan.
- Iterate the design against simulation results, adjusting door assignment or staging geometry rather than treating the first layout as final.
Recent matheuristic research on cross-dock door design backs step six specifically: it recommends stress-testing a design against peak volume, door disruption, and mix-shift scenarios rather than approving a footprint based on average throughput alone, since average-day sizing is exactly what produces the costly surprises during peak season.
A 2024 cold-chain simulation case study reported significant improvements in deliveries and reductions in forklift travel after a targeted layout redesign that moved high-turnover flows closer to the unloading area. That FlexSim-based case study is a single documented example, not a universal benchmark, but it shows the order of magnitude available from a focused layout change rather than a full rebuild.
During a pilot or simulation run, track dock utilization rate, average forklift travel distance, dwell time per load, and percentage of late departures. Those four numbers together tell you whether the design is working before a single real customer shipment is at risk.
Safety and Compliance Considerations in Cross Dock Design
Dock-area safety risk concentrates at exactly the points where cross-dock design adds complexity: crossing traffic lanes, high forklift density near staging, and trailers coming and going on tight schedules. Separating inbound and outbound pedestrian and forklift paths, the same layout rule that reduces travel distance, also reduces the collision risk that comes with two-directional traffic sharing a staging line.
Dock leveler and trailer restraint systems need to match the trailer mix actually running through the facility, since a facility handling a wider range of trailer heights and ages needs more conservative leveler specifications than one running a standardized fleet. Staging lane markings should be clear enough that a lane at capacity is visually obvious, not just flagged in the WMS, since floor-level visual cues catch overflow before it becomes an aisle obstruction.
Compliance requirements will vary by jurisdiction and by the product category moving through the building, particularly for temperature-controlled or food-grade freight, where documentation and physical verification both need to hold up to audit. Build compliance checkpoints into the same workflow steps that handle ASN verification and exception handling rather than treating them as a separate process layered on top, since a second parallel process is where compliance steps get skipped under time pressure.
Environmental and Sustainability Aspects of Cross-Dock Layouts
A cross-dock’s biggest sustainability lever is usually the one baked into the layout decision anyway: shorter forklift travel distances mean less fuel or battery draw per load moved, so the same flow-first design principles that cut dwell time also cut energy use per pallet handled. Facilities with natural light at staging areas and dock doors reduce daytime lighting load, and dock door seals that fit the trailer mix running through the building cut the conditioning loss that happens every time a door sits open against an irregular trailer profile.
Electric forklift fleets shift the sustainability question from fuel consumption to charging infrastructure and shift scheduling, since a fleet sized to the transition-point logic described earlier also avoids the energy waste of running more equipment than a given wave actually needs. Building orientation and dock door placement relative to prevailing wind and sun exposure are easier to influence at the design stage than after construction, which is one more reason flow mapping and facility shape should be settled before groundbork begins rather than adjusted after the fact.
Integrating Cross-Dock Design with Transportation Modes and Yard Management
A cross-dock design is only as good as the yard feeding it. Trailer staging in the yard needs to mirror the door-assignment logic inside the building, since a yard that lets trailers queue randomly defeats a carefully planned strip or mixed-door schedule the moment trucks start backing up at the gate. Appointment scheduling has to account for the transportation mode mix: LTL carriers, dedicated fleet, and rail-fed drayage each bring different arrival variability, and a facility running all three needs yard management rules flexible enough to sequence them without one mode’s delays cascading into another’s door window.
Real-time yard visibility, knowing which trailer is where and which door it is assigned to, closes the loop between the WMS dock-status data described earlier and the physical yard. Facilities near rail or port access carry an added layer of scheduling complexity, since drayage windows are often less flexible than over-the-road appointments, and that constraint should feed back into door-count and staging decisions rather than being treated as a yard-only problem.
Choosing and Placing Loading and Unloading Equipment
Equipment choice should follow from the flow matrix and door strategy, not the other way around. Dock levelers, whether fixed, hydraulic, or air-powered, need to match the trailer height range and the volume cycling through each door; a high-turnover strip-assigned door justifies a faster-cycling leveler than a low-volume flex door. Conveyor spurs or powered rollers make sense at doors handling high-volume, uniform-size freight, while doors handling mixed pallet configurations are usually better served by forklifts and pallet jacks that can adapt load by load.
Placement matters as much as selection: equipment staged too far from its assigned door adds travel time to every single cycle, which compounds fast at high-turnover doors. For facilities evaluating conveyors, sortation, or robotic material handling as part of an equipment upgrade, guidance on automating warehousing without disrupting existing operations covers incremental approaches to adding automated handling without rebuilding an operation around it in one step, a relevant read before committing capital to conveyor or robotic infrastructure at specific doors.
Designing Staging and Doors with Room to Scale
A design sized exactly to today’s volume is a design that needs a costly retrofit the first time the network grows. Building spare staging capacity and leaving structural allowance for additional doors, even if they are not fitted out on day one, costs far less at construction than after the building is operating at capacity. The same flow-matrix approach used for the initial design can be rerun against a growth scenario to check whether the staging geometry and door count still hold up at a higher volume.
Flexible-use floor space, areas that can convert between staging and overflow storage depending on the week, buys more scalability than a fixed layout optimized only for current peak. Facilities that anticipate network changes, new carrier relationships, or shifting origin-destination mixes benefit from reviewing distribution network design alongside the facility-level layout, since a cross-dock sized well for today’s network can become the wrong shape entirely if the broader network shifts around it.
Ergonomics and Layout: Where Facility Design Meets Labor Efficiency
Travel distance is not just an efficiency number, it is also a fatigue number. The same layout changes that cut forklift travel, shorter corridors, high-turnover flows near unloading, clear lane separation, also cut the walking distance and repetitive handling that wear down staging and loading staff over a shift. A facility that forces workers to carry or walk freight long distances between staging and the outbound door sees both slower cycle times and higher injury risk concentrated in the same bottleneck areas.
Workstation height, lane width, and the placement of hand tools or scanning equipment at each door all affect how long a worker can sustain pace without fatigue-driven errors creeping in. Staging lane design that keeps frequently accessed freight at a consistent, reachable height reduces the awkward lifting angles that drive a disproportionate share of dock-area injuries. Facilities that treat ergonomics as part of the layout decision, not a separate safety add-on, tend to see steadier throughput across a full shift rather than a sharp falloff in the final hours.
Operator Perspective: Pragmatic Tradeoffs and Common Pitfalls
The most common cross-dock design mistake is sizing to an average day and discovering the real constraint during the first real peak. A close second is freezing staging lane assignments at launch and never revisiting them, even as flow patterns shift month to month. Ignoring forklift transition points is the third: facilities add equipment as a reflex when the actual fix is scheduling, or they under-invest in equipment and blame labor for a bottleneck that more forklifts would have resolved in an afternoon.
Before committing capital, run cheap experiments: reassign staging lanes temporarily and measure the travel-distance change, tighten appointment windows for one carrier lane and watch dock utilization shift, or simulate a single high-volume route in isolation before stress-testing the whole network. Capital spending on additional doors or conveyor infrastructure earns its cost when the flow matrix shows a structural gap. Process change, door reassignment, staging reconfiguration, tighter scheduling, usually delivers higher return first.
— Michael
How We Help You Get Cross-Dock Design Right the First Time
A cross-dock design that looks right on paper and a cross-dock design that survives a real peak week are two different things, and the gap between them is usually a door-count assumption or a staging decision nobody stress-tested. We bring extensive hands-on operating experience to exactly that gap, validating door counts against your actual wave data, running the scenario tests a new design needs before you commit square footage, and checking operator readiness before go-live rather than after.

We work both sides of this problem: helping brands evaluate whether a cross-dock layout actually fits their network, and helping 3PL operators pressure-test a design before it becomes a capital commitment. Specific engagements include:
- Door-count and staging validation against your real flow matrix, not an average-day assumption.
- Simulation-backed stress testing for peak volume, disruption, and mix-shift scenarios.
- Operator-readiness review before a new or redesigned facility goes live.
- Warehouse RFP management when the design decision is tied to selecting or re-contracting a logistics partner.
If your facility is heading toward a multi-door design, a high-variability network, or a peak event you cannot afford to get wrong, scope a conversation through our services overview and we will walk through where the real risk sits before you finalize anything.
FAQ
What is a cross-docking facility?
A cross-docking facility moves freight from inbound trailers to outbound trailers with minimal or no time in storage, either directly door to door (single-touch) or through a brief staging step for sorting or consolidation (two-touch). The Produce Traceability Initiative’s cross-docking guide treats this as a distinct operating mode with its own traceability requirements, not a smaller version of a storage warehouse.
What are the advantages and disadvantages of cross-docking?
Cross docking can cut lead time and reduce storage cost by consolidating LTL freight into full truckloads and moving perishable or peak-season volume through without a storage step. The tradeoff is operational complexity: door scheduling, staging lane management, and forklift coordination all need tighter coordination than a conventional pick-and-store warehouse, and a design sized only to average volume tends to buckle during real peaks.
What are the different types of cross-docking?
The main variants are single-touch, where freight moves straight from an inbound to an outbound door, and two-touch, where freight pauses briefly in a staging lane for sorting or consolidation. Door-assignment strategy adds another layer of variation, with strip-door, stack-door, and mixed-door models each suited to different levels of day-to-day volume variability, as detailed in research on the cross-dock door design problem.
How much does it cost to cross dock?
Published figures for cross-dock cost vary widely by facility size, door count, automation level, and region, and no single reliable per-pallet or per-facility figure applies across the industry. Cost drivers that matter most in practice are door count, staging square footage, material-handling equipment and labor, and WMS and integration costs, each of which should be estimated against your own flow matrix rather than a generic industry rate; our fulfillment cost benchmarking work builds those estimates against real operating data.
Sources
- A methodology for the cross-dock door design problem under uncertainty
- Layout and control policies for cross docking operations (Vis & Roodbergen)
- Multi-door cross-dock scheduling under flexible doors mode and material handling resource restrictions
- Cross-docking best practice guide (Produce Traceability Initiative)