
Accurate staffing to demand cuts overtime and stops missed service levels before they start. This week, freeze your volume and headcount inputs, convert that forecast into department-level shift staffing, and pick one KPI, overtime percentage or orders per labor-hour, to track daily. The rest of this guide covers forecasting, scheduling, KPIs, variability, a repeatable workflow, technology, and proof that the approach works at scale.
TL;DR:
- Use stable forecast methods like moving averages with day-of-week adjustments unless your demand patterns require segmentation, such as multi-line orders.
- Build standard times from historical data before relying on complex forecast models to ensure accuracy in workload-to-staffing conversions.
- Set staffing targets 24 hours before shifts begin, including buffers for absenteeism, and use checkpoints during shifts to trigger staffing adjustments based on actual throughput.
- Track key KPIs daily or weekly, including orders per labor-hour, overtime percentage, and unplanned absence rates, to inform real-time staffing decisions.
- Automate data collection from WMS, order management, and attendance systems, and maintain an audit trail of overrides to prevent and diagnose staffing failures.
Table of Contents
- Core concepts every labor plan needs
- Choosing a forecasting method that fits your data
- Turning staffing numbers into a working schedule
- The KPIs that actually drive staffing decisions
- Planning for the labor you can’t fully predict
- A weekly and monthly cadence that keeps the plan honest
- Getting your data and systems to support the plan
- Mistakes that quietly wreck a labor plan
- What the numbers say when you get this right
- An operator’s blunt take on labor planning
- How an operator-led advisory closes the gap
- Primary sources and benchmarks to consult
- Sources
- FAQ
Core concepts every labor plan needs
Labor planning runs on three ideas: forecast horizon, workload conversion, and functional allocation. Same-day forecasts adjust staffing for what already happened this morning. One to four week forecasts drive the shift schedule you publish. Seasonal forecasts, built months out, set your hiring and training calendar.
Workload-to-staffing conversion turns a volume number into a headcount. You take units, orders, or lines, apply a standard time (minutes per unit based on historical throughput per hour, or TPH), and get required labor-hours. Facilities with engineered labor standards get tighter conversions; those without them should build standard times from at least several weeks of clean historical data before trusting the output.
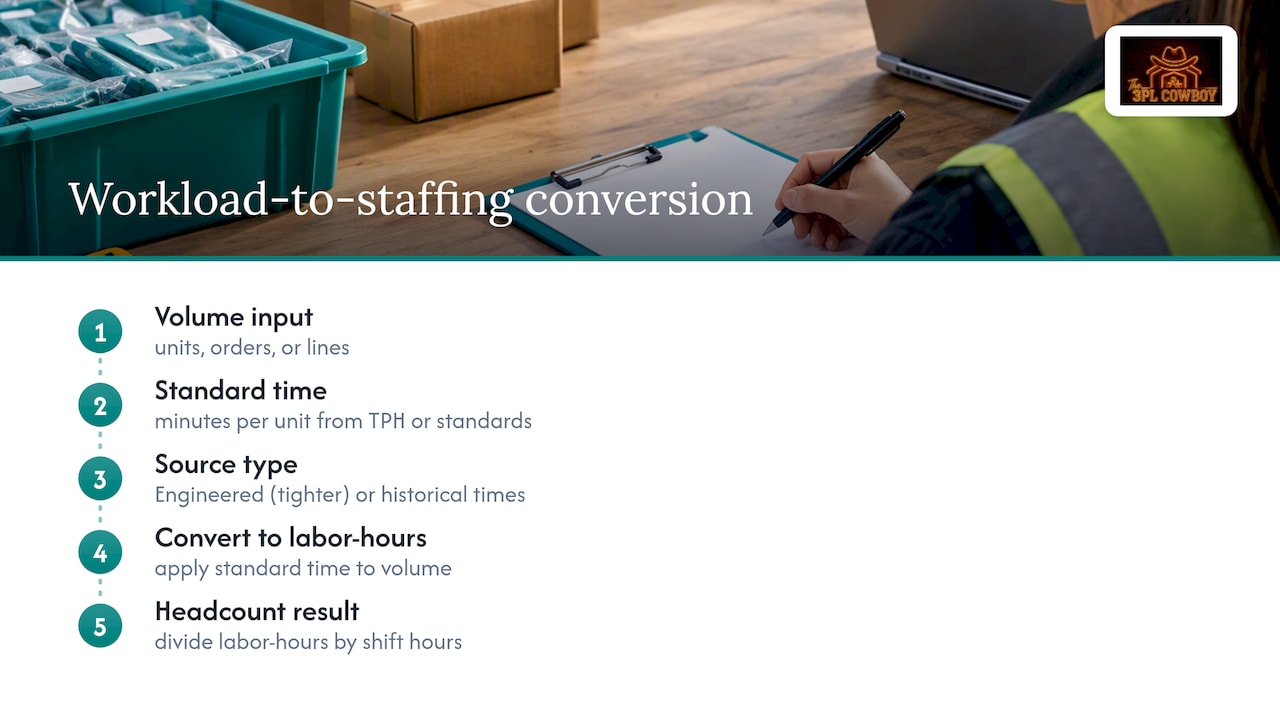
Allocating by functional bucket, receiving, putaway, replenishment, picking, packing, and shipping, matters because each department has a different TPH and a different sensitivity to volume spikes. A single blended labor number hides where the actual shortfall will hit on the floor.
Choosing a forecasting method that fits your data
Most facilities should start simple and add complexity only as data quality allows. A moving average with day-of-week adjustments handles stable, repeat-pattern volume well. Layer in promotion overlays and known event dates, and you cover the next tier of accuracy without new software.
Stratified forecasting segments your order profile, single-line orders, multi-line, bulk, and each labor pool, so a picker-heavy promotion doesn’t get smoothed into an average that understaffs packing. Machine learning models can improve accuracy further, but they need months of clean, labeled historical data and a stable process behind them; skip ML until your basic forecast is reliable.
The MIT CTL Wesco labor optimization model shows what higher accuracy can look like: a mixed integer linear programming model allocated labor by department and, in a full-scale validation run, completed a large number of same-day tasks with a minimal amount of total overtime hours required. The model recommended headcounts per department rather than individual assignments, which kept managers in control of who actually worked the shift.
- Moving averages with day-of-week adjustments cover stable, repeat-pattern demand.
- Stratified forecasts by order profile catch the volume spikes a blended average misses.
- Machine learning needs months of clean data before it outperforms simpler methods.
Pro Tip: Build your standard times before you build your forecast model. A sophisticated forecast on top of bad TPH data just produces a confident wrong answer.
Turning staffing numbers into a working schedule
A staffing target only matters once it becomes a roster. Shift design should stagger start times around your peak inbound or outbound windows, mix experience levels on each shift, and define a float pool that can move between departments without a manager hunting for volunteers.
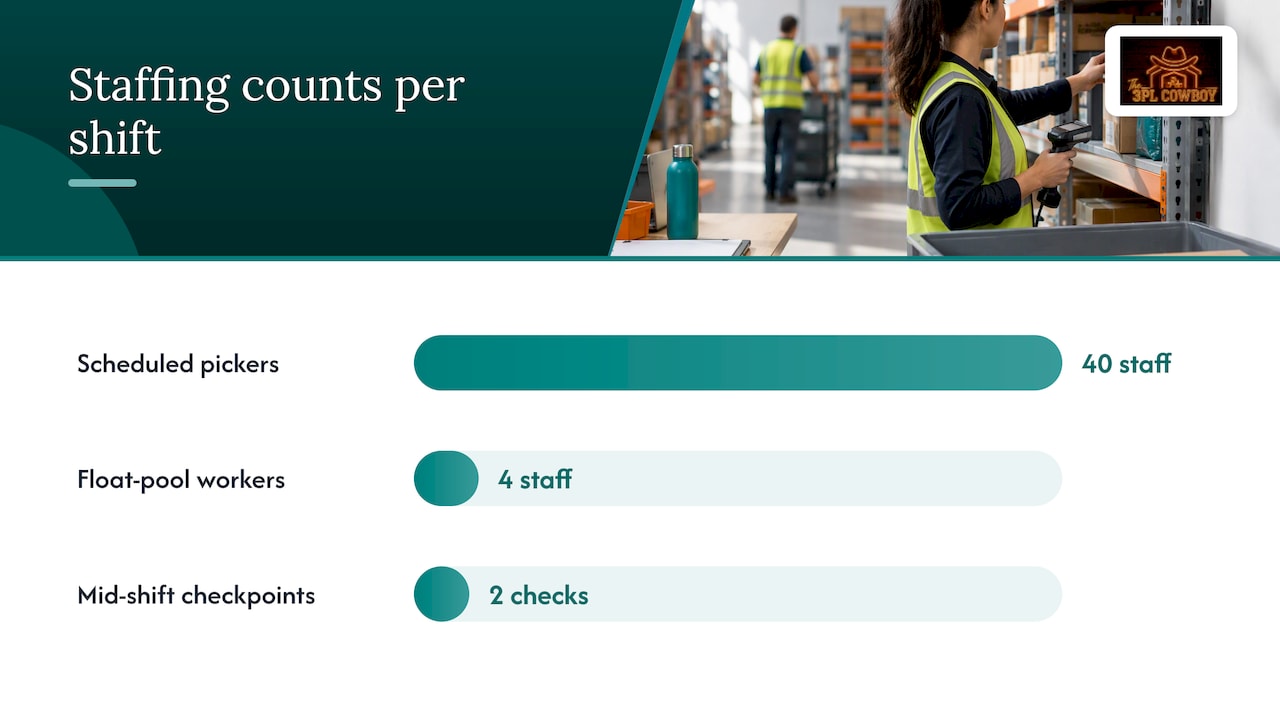
Convert labor-hours to shift counts by dividing the forecasted hours per department by your standard shift length, then round up and build in a small buffer for absenteeism. A facility expecting 320 picking labor-hours on an 8-hour shift needs 40 scheduled picker-shift staff, plus a margin for no-shows.
- Freeze the staffing target by 24 hours before the shift starts.
- Build the roster with a mix of core staff and float-pool workers.
- Set a mid-shift checkpoint at the two-hour and five-hour marks to compare actual throughput against plan.
- Trigger voluntary time off (VTO) or voluntary extra time (VET) based on a pre-defined volume threshold, not a supervisor’s gut call.
- Escalate to the next shift lead only when the gap exceeds your threshold for two consecutive checkpoints.
A mixed-order facility running both single-line e-commerce and bulk retail orders might staff picking with a core crew sized to single-line volume, then hold four float-pool workers who shift to bulk picking only when that queue backs up.
Pro Tip: Write your VTO and escalation thresholds down before peak season starts. Deciding them in the middle of a bad shift guarantees inconsistency.
The KPIs that actually drive staffing decisions
A short KPI set beats a long one nobody checks. Track orders or lines per labor-hour, picks per hour by department, overtime percentage, unplanned absence percentage, and cost per case. Each should have an owner and a review cadence, daily for overtime and absence, weekly for cost per case.
- Orders or lines per labor-hour measures overall productivity against your forecast.
- Overtime percentage flags whether your staffing plan consistently undershoots demand.
- Unplanned absence percentage tells you how much buffer you need in tomorrow’s roster.
- Cost per case ties labor performance back to the budget line finance actually watches.
WERC’s DC Measures benchmarking study publishes industry medians for metrics like orders picked per hour and unplanned absence percentage, giving planners a seven-step benchmarking process to set targets and close gaps against peers rather than guessing. Use those medians as a starting target, then tighten them once you have several months of your own data. When overtime or absence drifts past your internal threshold for two straight days, that’s the trigger to pull float-pool labor or adjust tomorrow’s roster, not wait for the weekly review.
Planning for the labor you can’t fully predict
Absenteeism and surge demand are the two variables that break clean forecasts. Track your no-call-no-show (NCNS) ratio separately from planned absence, since it’s the harder cost to staff around. DailyPay’s analysis of unscheduled absenteeism estimates the all-in burden, overtime coverage, temp markups, and lost productivity, averages roughly $3,600 per hourly worker annually, which makes a dedicated float pool cheaper than it looks on paper.
- Build a float pool sized to your historical absence rate, not your best-case scenario.
- Set temp agency call thresholds in advance so surge coverage isn’t a same-day scramble.
- Use part-time shifts to cover predictable peak windows without inflating full-time headcount.
- Start seasonal hiring and training early enough that new staff are productive before peak, not during it.
Cross-training matters most here: a worker who can flex between receiving and packing absorbs an absence spike without triggering a temp agency call.
A weekly and monthly cadence that keeps the plan honest
Labor plans decay fast without a repeatable cadence. Run this weekly: freeze volume and headcount data on a fixed day, hold a short assumptions review with planning, operations, and HR, build the staffing plan from the frozen inputs, publish the roster at least 24 hours ahead, then review actual-versus-plan performance before the next freeze.
- Freeze data: lock forecast volume, current headcount, and known absences by the same time each week.
- Review assumptions: planner, ops lead, and HR confirm promotions, holidays, and known gaps before staffing is built.
- Build staffing: convert frozen volume to department labor-hours and shift counts.
- Publish the roster: give staff and float-pool workers at least a day’s notice.
- Review performance: compare actual throughput and overtime against the plan before the next freeze cycle.
On a monthly or rolling 13-week basis, add scenario planning for demand swings, update the hiring plan against lead times, and reset the overtime budget against actuals. Finance should sit in on the monthly review since overtime and temp spend both hit the same budget line the weekly cadence is meant to protect.
Getting your data and systems to support the plan
Clean data matters more than any specific platform. Prioritize your warehouse management system (WMS) for throughput and task data, your ERP or order management system for forecast-relevant demand, and your attendance or time-and-labor system for actual hours worked. Those three feeds, reconciled against each other, are the foundation every forecast and KPI in this guide depends on.
- Pull TPH and task completion data from the WMS, not from manager estimates.
- Reconcile order management forecasts against actual order mix weekly, not monthly.
- Feed attendance data into the same labor plan that feeds scheduling, so absence shows up where it affects staffing.
Amazon’s ALAP system automated its weekly assumptions workflow across more than 100 sites and cut the time planners spent assembling assumptions by about 70%, shifting their work from data assembly to review and override. That pattern, a centralized data layer feeding an event-driven workflow, is worth copying even without Amazon’s scale: automate the data pull, keep a human reviewing and approving every override.
Pro Tip: Whatever you automate, keep an audit trail of every override. The first time a staffing miss happens, you need to know whether the model was wrong or a manager changed it.
Mistakes that quietly wreck a labor plan
Four mistakes show up in almost every struggling labor plan. Spreadsheet-only planning breaks down once more than one person edits it. Fix it by moving the forecast and roster into a shared system with version control, even a simple one.
- Spreadsheet-only planning: move to a shared, version-controlled system before headcount grows past one facility.
- Stale assumptions: freeze inputs on a fixed schedule instead of updating them ad hoc mid-week.
- Blended, department-agnostic forecasts: split the forecast by functional bucket before converting to staffing.
- No validation check: compare last week’s forecast against actual volume every week, not just when something goes wrong.
What the numbers say when you get this right
Proof that disciplined labor planning scales comes from operations that have done the hard version of it. A pallet-program redesign for Kroger delivered more than $6 million in annual savings, and an 8-month WMS rollout across more than 60 Sysco sites showed that even large, multi-site labor and inventory systems can be standardized on a fixed timeline.
A manageable pilot for your own floor: pick one department, run a two-week test where you freeze forecast inputs and track orders per labor-hour and overtime percentage daily against your current baseline. If overtime drops and throughput holds, scale the cadence to the next department. If your internal team can’t close the gap after two pilot cycles, that’s the signal to bring in outside help.
An operator’s blunt take on labor planning
Most labor plans fail for a boring reason: nobody fixed the data before buying a model to run on it. Fix TPH and attendance data first, automation later. Cross-train before you need to, not during the surge when it’s too late to train anyone. Enforce the weekly assumptions review even when the week is calm. Firefighting feels productive, but it never builds the capability that makes next quarter’s fire smaller.
— Michael
How an operator-led advisory closes the gap
Most of this playbook you can run yourself with a spreadsheet, a WMS export, and a weekly meeting on the calendar. Where it gets harder is when labor planning collides with a bigger decision: whether to outsource a function, redesign your network, or renegotiate a 3PL contract because labor costs are driving the number up.

3PL Cowboy’s 3PL Operations Advisory and Peak & Overflow Capacity work exist for exactly that collision point, operator-led, with no warehouse to fill and no listings to sell you. If your team can hit its KPI targets with the cadence above, stay DIY. If overtime keeps climbing despite a disciplined plan, or you’re weighing a 3PL switch that hinges on labor cost assumptions, that’s the signal to bring in outside diligence. Check our full range of services to see where hands-on help fits your situation.
Primary sources and benchmarks to consult
- MIT CTL Wesco labor optimization model
- WERC 2023 Best Practices & DC Measures
- Amazon ALAP automation (AWS blog)
- DailyPay absenteeism cost analysis
- BLS warehousing industry data
- Frontline Factor benchmark dashboard
Sources
- Designing a labor optimization model for Wesco | MIT Center for Transportation & Logistics
- Automating Amazon ATS labor planning with serverless AWS | Amazon Supply Chain and Logistics (AWS blog)
- WERC 2023 Best Practices & DC Measures (WERC report)
- The hidden cost of absentee employees | DailyPay resource center
FAQ
What are the five S’s in a warehouse?
The five S’s, sort, set in order, shine, standardize, and sustain, are a workplace organization framework adapted from lean manufacturing. In warehouse labor planning, they support efficiency by keeping workstations consistent enough that standard time estimates stay accurate across shifts.
What are the 7 principles of warehousing?
Definitions vary across sources, but common versions include accuracy, space utilization, equipment use, labor productivity, safety, inventory control, and cost efficiency. Labor planning connects most directly to productivity and accuracy, since both depend on reliable staffing against forecasted volume.
What are the five KPIs for a warehouse?
A practical set includes orders or lines per labor-hour, picks per hour, overtime percentage, unplanned absence percentage, and cost per case. WERC’s DC Measures benchmarking study publishes industry medians for several of these so planners can set realistic targets.
What are the five key skills of a warehouse worker?
Core skills generally cited across the industry include accuracy and attention to detail, physical stamina, basic technology or scanner proficiency, teamwork, and safety awareness. These skills matter directly for labor planning because cross-trained, accurate workers make float pools and flexible scheduling actually work.